
Mining Social Media Streams: Turning Tweets into Public Health Allergy Sensors
Mining Social Media Streams to Improve Public Health Allergy Surveillance
The paper introduces a real-time allergy surveillance system that mines large-scale Twitter streams to monitor allergy prevalence. By combining a NaiveBayesMultinomial classifier with spatiotemporal analysis, the authors successfully identified predominant allergy types and correlated social media trends with physical environmental data.
TL;DR
Allergies affect one in five Americans, yet tracking them in real-time is notoriously difficult. This research presents a framework to transform millions of public tweets into a precise surveillance tool. By distinguishing between "I have an allergy" and "Allergies are bad this year," the system extracts seasonal trends and identifies specific allergens (like peanut or pollen) with high accuracy, showing that our social media "chatter" mirrors actual environmental pollen levels.
The "Signal vs. Noise" Challenge in Health Surveillance
While Twitter is a goldmine for real-time data, it is inherently noisy. A search for "allergy" returns a mix of personal suffering, pharmaceutical advertisements, news reports, and general advice. To be useful for public health officials, a system must isolate actual incidents.
Previous works primarily focused on infectious diseases like Influenza. This paper shifts the focus to chronic allergies, where the "outbreak" is driven by environmental triggers rather than viral transmission.
Methodology: From Raw Text to Health Insights
1. The Classification Engine
The authors manually labeled 2,000 tweets to train a supervised learner. They found that specific personal pronouns (I, me, my) were critical features. Using a NaiveBayesMultinomial (NBM) classifier, they separated "positive" incident reports from "negative" general awareness.
2. Automatic Allergy Discovery
Instead of using a static list of keywords (which might miss new trends), the researchers used Part-of-Speech (POS) tagging. By filtering for "Noun-Noun" 2-gram patterns (e.g., "peanut allergy," "pollen allergy"), they could automatically discover what people were suffering from.
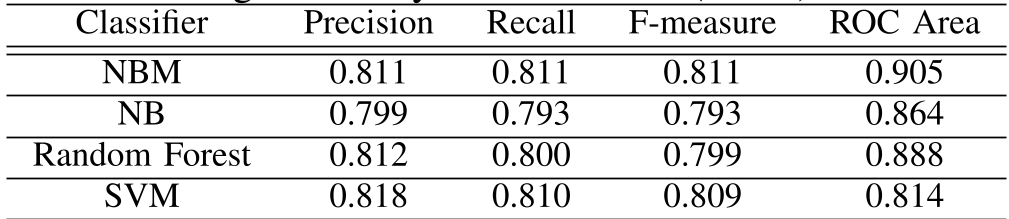 Table: Comparison of various classifiers. NBM and SVM consistently outperform standard Naive Bayes.
Spatiotemporal Correlation: Does Python Match Pollen?
The most compelling evidence for the system's validity is found in the correlation with physical world data.
- Seasonality: The volume of tweets peaks sharply in mid-May and mid-September, perfectly aligning with traditional spring and fall allergy seasons.
- Climate Link: The study found a correlation of 0.688 between daily maximum temperatures and tweet volume. As it gets warmer, pollen counts rise, and the "Twitter sensors" signal an increase in suffering almost immediately.
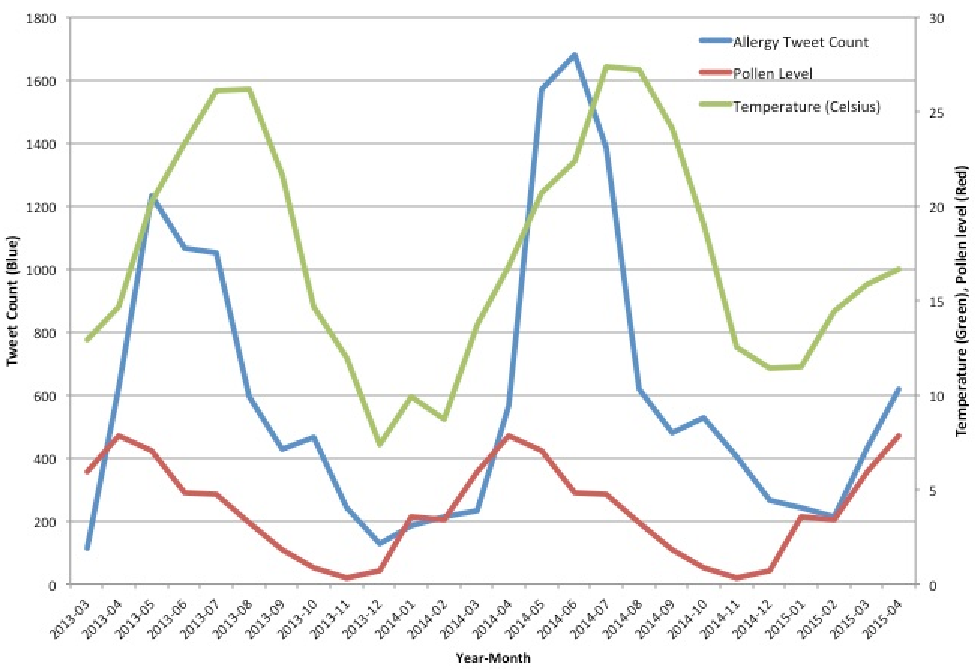 Figure: The synchronization of tweet counts (blue), temperature (green), and pollen levels (red).
Mapping the Allergy Landscape
By extracting geolocation and user profile data, the system can map allergy severity across the U.S. Interestingly, the data revealed that while "pollen allergy" tweets fluctuate heavily with seasons, "peanut allergy" tweets remain relatively constant—suggesting that food allergies are a persistent concern regardless of the weather.
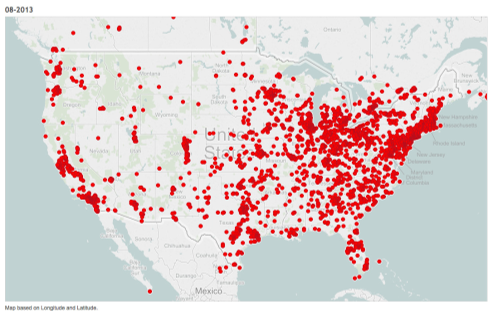 Figure: Visualizing U.S. allergy activity across different seasons using geocoded tweets.
Critical Insight & Conclusion
This work demonstrates that social media is more than just a platform for opinions; it is a massive, distributed sensor network.
Key Takeaways:
- High Precision: Automated discovery of allergy types reached 86.7% precision.
- Validation: Twitter data closely matches clinical "Ground Truth" for the most prevalent food allergies (Peanut, Wheat/Gluten, Milk).
- Future Potential: This model isn't limited to allergies; it can be adapted for any condition where symptoms are shared publicly, potentially predicting healthcare strain before patients even reach the clinic.
While the 140-character limit of the era (2015) presented challenges, the core logic remains relevant: context matters more than keywords. By leveraging linguistic structure and environmental context, we can turn public data into life-saving public health intelligence.