
Mining the "Social Tribe": How Photos Reveal Hidden Human Networks
Mining Social Networks and Their Visual Semantics from Social Photos
The paper proposes a method to automatically extract social networks and their visual semantics from "social photos" by analyzing the co-occurrence of individuals. Using a wedding as a case study, it introduces three "social forces" (Simple Force, Proximity, and Cohesion) to model relationships and employs hypergraphs and Formal Concept Analysis to generate personalized photo albums for event participants.
TL;DR
Long before modern AI face-tagging became ubiquitous, researchers Michel Crampes and Michel Plantié tackled a profound question: Can the simple act of people appearing together in photos reveal the underlying fabric of a social network? This paper introduces a framework to extract social networks from "social photos" using math-heavy concepts like Formal Concept Analysis and Hypergraphs, eventually automating the distribution of personalized photo albums based on "social tribes."
The Core Motivation: Photos as Active Actors
In most social platforms, photos are passive—you upload them, tag people, and they sit there. The authors argue that photos should be active agents. By looking at who stands next to whom, how often they appear together, and whether they appear in small intimate groups versus large crowds, we can reverse-engineer the "Social Semantics" of an event like a wedding.
The authors identify a major pain point in digital life: The Album Personalization Problem. Sending all 1,000 wedding photos to everyone (Strategy 3) is spam; sending only photos where a person is tagged (Strategy 1) misses the photos they actually want (e.g., a grandfather wanting photos of his grandson).
Methodology: The Three "Social Forces"
To bridge this gap, the paper defines how we measure the "strength" of a social bond through the lens of a camera:
- Simple Force (Frequency): How often do Person A and Person B appear together? This identifies the "stars" of the event (the Bride and Groom).
- Proximity (Dilution Factor): A link between two people is stronger if they appear together in a small group. If they are just two faces in a crowd of fifty, the link is weak.
- Cohesion (Inseparability): This is the most "social" metric. If Person A and Person B are only ever seen together and never apart, they have high cohesion (think of a close-knit couple or siblings).
From Graphs to Tribes
The authors don't just stop at lines between dots. They use Hypergraphs (where an "edge" can connect more than two people) to find "Tribes"—sub-groups that share common interests.
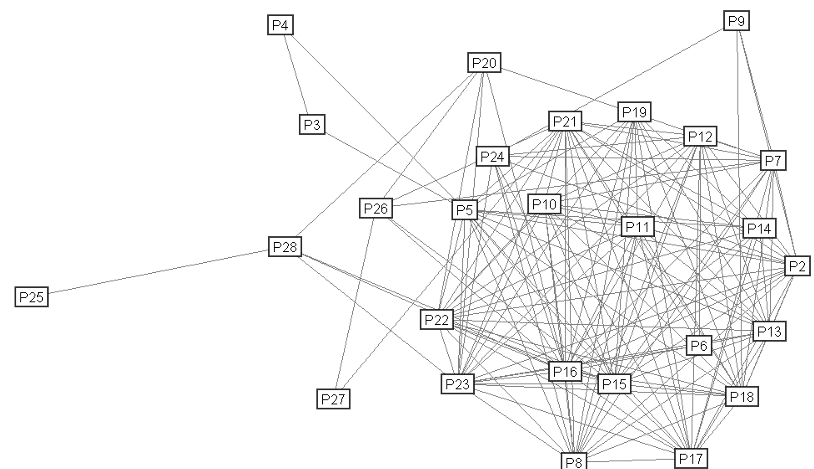 Above: The raw "Cohesion" graph before reduction, showing the complex web of real-world interactions.
Experiments: The Wedding Case Study
The researchers tested their theory on a wedding with 144 photos and 28 people. They compared their AI-generated networks to a "Civil Graph" (the official family tree).
Key Insights from the Data:
- The Starfish vs. The Chain: "Simple Force" created a "starfish" topology centered on the newlyweds. "Cohesion," however, revealed a flatter network of physical interactions—who actually spent time talking to whom.
- Tribe Distribution: By using the Jaccard distance (measuring the overlap between people in a photo and members of a tribe), the system could predict which photos a guest would actually find meaningful.
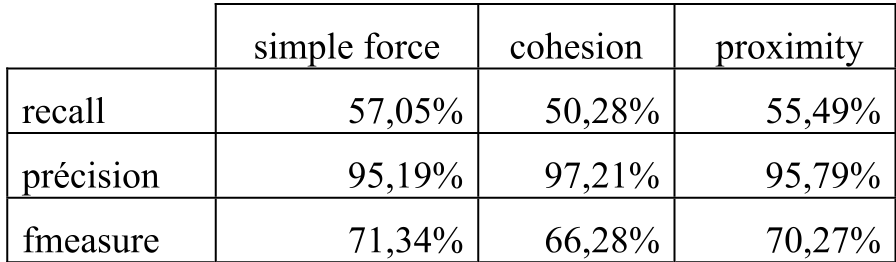 The Strategy 2 (Tribe-based) showed over 95% precision, proving that "Social Forces" are a highly accurate way to filter content.
Critical Analysis & Future Outlook
While this work was published in 2011, its logic is the ancestor of modern recommendation engines.
- Limitations: The "reduction" process (dropping 75% of links for visibility) risks losing nuance. Furthermore, it assumes that the photographer is an unbiased observer, which we know isn't true—photographers have their own "social bias."
- The Legacy: This paper shifted the focus from Visual Recognition (What is in the photo?) to Visual Sociology (What does the photo say about us?). For today’s developers, it suggests that the richest "metadata" isn't in a file header, but in the topological patterns of human proximity.
Takeaway: Your photo gallery isn't just a collection of memories; it is a mathematical map of your social reality.