
Hybrid Wavelet Models: Decoding Temporal Patterns in Diabetic Care
Mining Temporal Patterns from Health Care Data*
The paper introduces a three-step temporal data mining framework designed to extract qualitative and quantitative patterns from longitudinal health records. By utilizing Wavelet Feature-based regression Models (WFMs) and the Haar wavelet basis, the method successfully identifies periodic and similar behavioral patterns in diabetes patient monitoring data.
TL;DR
This research presents a sophisticated three-step framework for mining temporal health care data. By combining Haar Wavelet Analysis for structural pattern recognition with Statistical Regression for value-based distribution analysis, the authors provide a global lens into patient compliance and medical treatment cycles. The result is a hybrid model that can distinguish between regular care, specialized treatment, and medical neglect in longitudinal diabetes records.
Problem & Motivation: The Gap in Temporal Mining
Medical records are often "sparse" and "discrete-valued," making traditional time-series analysis difficult. Previous works generally focused on one of two angles:
- Shape/Structure: Identifying how a value changes (up, down, stable).
- Values: Identifying what the actual numbers or frequencies are.
The authors argue that a "Global Pattern" is only visible when you look at both. For instance, a patient might visit the doctor every 3 months (Value/Frequency) but the type of tests they undergo might fluctuate in a specific shape (Structure). Bridging these two dimensions is the core motivation of this study.
Methodology: The Three-Step Pipeline
The authors propose the Wavelet Feature Model (WFM), which operates across three distinct phases:
1. Structure-Based Search
The system defines a state-space consisting of nine distinct local features (e.g., values increasing then decreasing). It uses a Haar Wavelet Function to decompose the signal and the Mahalanobis Distance to measure the similarity between different patient "shapes."
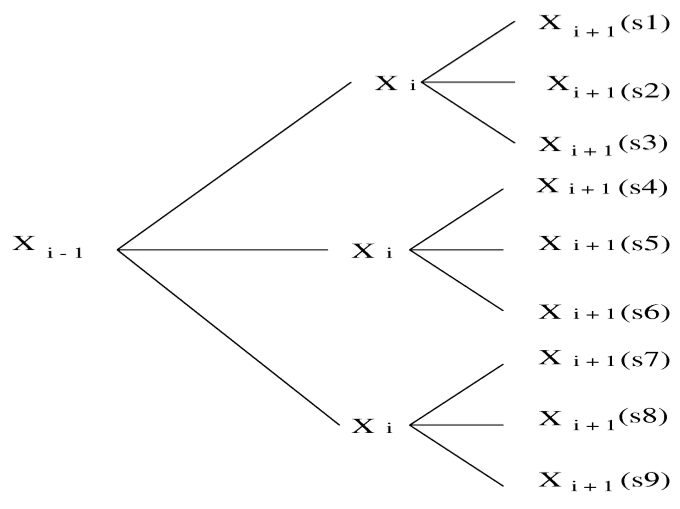 Figure 1: Definition of the nine distinct states based on 3-point temporal trends.
2. Value-Based Search
While the first step finds the "shape," this step looks at the "intervals." Using Local Linear Models and Taylor Expansions, the researchers estimate the distribution of time gaps between events. This allows them to identify if a pattern is Poisson, Exponential, or Geometric.
3. Global Hybrid Modeling
Finally, the two groups are merged. The model calculates the conditional probability of an observed value given a structural state . This allows the system to predict patient behavior across different medical "Test Groups" (e.g., Glycated hemoglobin vs. Cholesterol tests).
Experiments & Results: Insights from Medicare Data
The framework was tested on a dataset of 4,916 elderly diabetic patients over a 4-year period.
- The Poisson Nature of Care: The study found that standard patient visits follow a Poisson distribution, suggesting that visits are stationary and independent in their increments.
- Distribution of Neglect: Patients who do not receive adequate care show a Log-normal distribution, meaning the "gaps" in their care extend significantly to the right (long periods without monitoring).
- Cross-Test Correlation: A strong correlation was found between Test Group 1 (HbA1c) and Test Group 5 (HbA1c + Cholesterol), modeled as:
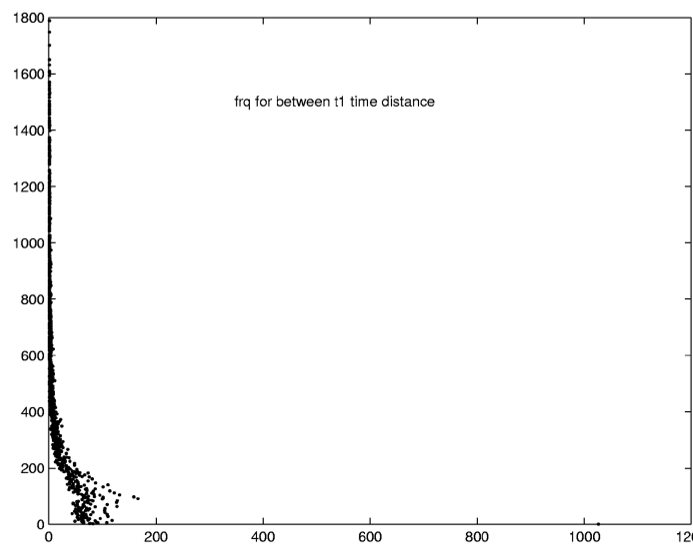 Figure 2: Distribution plots showing the Poisson nature of test groups 1 and 5.
Critical Analysis & Conclusion
Takeaway
The integration of wavelets and regression provides a powerful diagnostic tool for health administrators. It moves beyond simple "frequency" counts to understand the topology of care.
Limitations
- Haar Simplification: While the Haar wavelet is computationally efficient, it is the "simplest" basis. More complex wavelets (like Daubechies) might capture smoother transitions in health better.
- Constant Gap Assumption: The model assumes a constant time gap for the discretized index, which may not always reflect the messy, irregular reality of clinical visits perfectly.
Future Work
The methodology demonstrates significant potential for predictive intervention. By identifying early "log-normal" shifts in a patient's temporal pattern, healthcare systems could flag individuals at risk of complications before they miss critical clinical windows.