
Sensing the City: Predicting Taxi Hotspot Shifts from Social Media Cues
Mining Twier and Taxi Data for Predicting Taxi Pickup Hotspots
This paper presents a two-step framework for predicting taxi pickup hotspots during road closure incidents by fusing Online Social Network (OSN) data with historical taxi trip records. Using a combination of NLP-based tweet classification and machine learning on spatial grids, it achieves approximately 86.04% accuracy in predicting relocated hotspots in New York City.
TL;DR
When roads close, taxi demand doesn't disappear; it moves. This paper introduces a system that "listens" to the New York City Department of Transportation's Twitter feed to identify road closures and then uses Random Forest models to predict exactly where new taxi pickup hotspots will emerge, achieving 86% accuracy within a precise 0.011-mile radius.
The "Death" and "Birth" of Hotspots
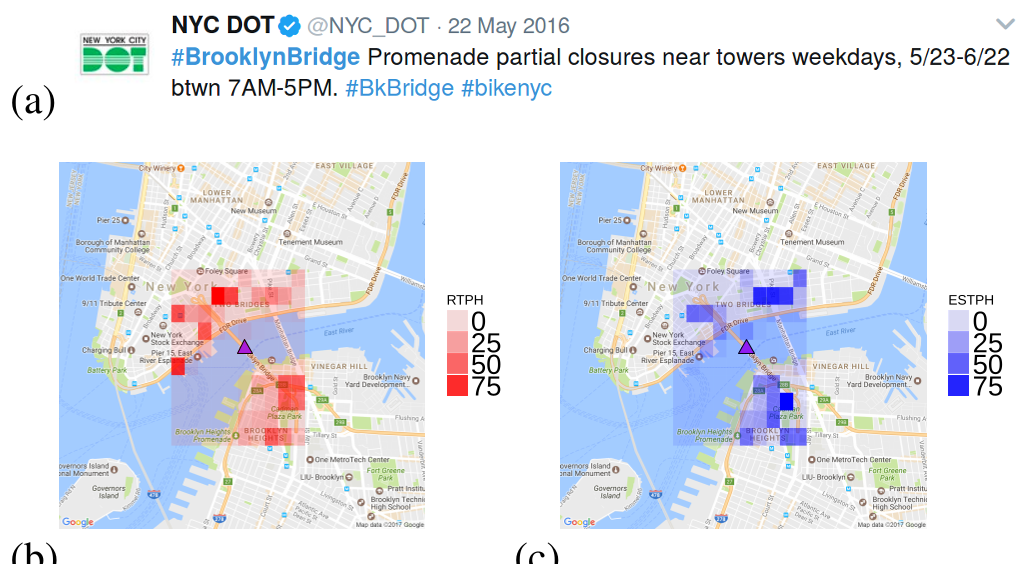
In a bustling metropolis like New York City, taxi drivers and commuters rely on "hotspots"—areas with high historical pickup density. However, road closures (maintenance, accidents, or events) trigger a phenomenon the authors call Hotspot Relocation.
The problem is twofold:
- Death of Old Hotspots: Historically reliable spots witness a sudden drop in passenger counts.
- Birth of New Hotspots: Demand shifts to neighboring blocks, often catching both drivers and commuters off guard.
The authors observed that hotspots shift by an average of 0.104 miles during events. While that sounds small, in Manhattan's dense grid, it is the difference between a successful fare and an empty cruise.
Methodology: From Tweets to Trips
The system operates in two distinct phases:
Phase 1: The NLP Social Sensor
The researchers crawled NYC DOT tweets, using a Bagging classifier to filter through the noise. Unlike general traffic tweets, they sought specific "road-closure" notifications.
- Feature Extraction: They used POS tagging to identify proper nouns (locations) and regular expressions to anchor dates and times (e.g., "10:00 am to 3:00 pm").
- Result: They achieved a 94.55% accuracy in identifying relevant tweets, effectively turning Twitter into a real-time event database.
Phase 2: Grid-Based Spatial Prediction
Once an event is detected, the area is discretized into a grid (specifically 0.2 x 0.2-mile cells within a 2-mile radius).
The model uses five core features to estimate pickup counts () in each cell:
- LCD: Latitude and Longitude coordinates.
- PHN (Pickup History of Neighborhood): Historical counts in the same time window over the last days.
- TOD & DOW: Time of Day and Day of the Week.
- DFL (Distance from Location): The assumption that the "traffic disturbance" impact fades as you move away from the epicenter.
Experimental Results
The study utilized a massive dataset of 163 million NYC taxi trips from 2015.
SOTA Comparison
By testing multiple algorithms (SVR, Linear Regression, Random Forest, Bagging), they found that Random Forest (RF) generally outperformed others for complex locations like the Brooklyn Bridge.

Key Performance Metric: In high-incident areas like Battery Park, the correlation between predicted and observed pickups reached 0.98, with the system predicting the center of new hotspots with surgical precision.
Critical Insights
The true value of this work lies in its Feasibility Analysis. The authors found that 40.47% of road closure locations repeat annually. This "repeatability" suggests that urban disruptions are not entirely chaotic; they follow patterns that machine learning can exploit once anchored by a social media "trigger."
Limitations & Future Work
The model's performance dipped significantly in areas with fewer incidents (e.g., WillAve Bridge), highlighting a dependence on data density. Furthermore, the NLP engine struggled with image-based notifications from Twitter—a growing trend in official government communications.
Conclusion
This paper bridges the gap between the "soft" data of social media and the "hard" data of urban transportation. By treating Twitter as a prefix to physical mobility shifts, the authors provide a blueprint for smarter, more responsive ride-hailing systems that can navigate the dynamic chaos of a modern city.