
Decoding Silence: Distinguishing "Dislike" from "Nothing" in Social Network Data
A missing value approach to social network data: “Dislike” or “Nothing”?
This paper introduces a statistical imputation procedure to disambiguate the absence of "Likes" on social network pages, categorizing them as either a negative opinion ("Dislike") or a lack of awareness ("Nothing"). Applying the Little test for MCAR, the authors demonstrate that social media non-responses are often Missing Not At Random (MNAR), necessitating a behavioral threshold-based approach to resolve data sparsity.
TL;DR
On social media, the absence of an interaction is not a neutral signal. This paper addresses the "sparsity silences" in social network datasets by proposing a statistical method to determine if a missing "Like" signifies a negative opinion or a simple lack of knowledge. Using a threshold-based imputation approach, the researchers move beyond binary 0/1 matrices to a more nuanced view of user behavior.
The Problem of the "Ambiguous Zero"
In social media analytics, we typically deal with rectangular matrices where rows are users and columns are "Likes." This results in extremely sparse data. The core challenge is that a 0 value is theoretically overloaded:
- Scenario A (Dislike): The user knows the page, dislikes the content, and chose not to click "Like."
- Scenario B (Nothing): The user has never seen the page or has no interest/knowledge regarding it.
Traditional approaches—like deleting incomplete cases—lead to massive information loss and significant statistical bias.
Methodology: The Propensity Threshold
The authors argue that a user’s knowledge of a category (e.g., "News TV Channels") can be inferred from their "Like" density.
1. Categorization and Density
Social media pages are grouped into categories (). For each user, a propensity score () is calculated:
2. The Behavioral Rule-of-Thumb
A threshold (the mean propensity of all users in that category) is established.
- High Engagement (): If you "Like" almost every news channel, and you didn't "Like" one specific channel, you likely know it and chose to ignore it (Impute: Dislike).
- Low Engagement (): If you only "Like" one niche channel, you likely haven't explored the rest (Impute: Nothing).

Proving the Mechanism: The Little Test
To justify this behavioral model, the authors used the Little MCAR Test.
- When testing channels individually, the data appeared "Missing Completely at Random."
- However, when testing channels jointly, the null hypothesis was rejected ( for most pairs), proving the data is MNAR (Missing Not At Random). This confirms that there is a systematic behavior behind why people don't "Like" certain pages.
| Channel Pair | Little Test (-value) | Conclusion |
|---|---|---|
| La7 & TGcom24 | 0.002 | Not Random (Behavioral) |
| TGcom24 & Sky TG24 | 0.004 | Not Random (Behavioral) |
Case Study: Italian TV Channels
The researchers analyzed 2,795 Italian Facebook users across three categories: News, Culture, and Entertainment.
Key Findings in News Channels:
- Total Potential Missing Values: 2,034
- Imputed as "Dislike": Only a small fraction (e.g., 4.3% to 12.6%).
- Imputed as "Nothing": The vast majority (e.g., 55.9% for Sky TG24).
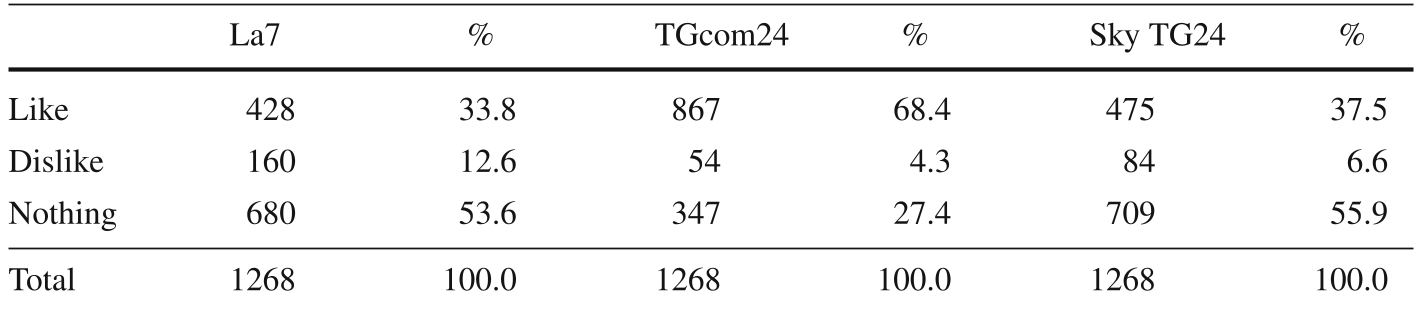
This reveals that "Sparsity" in social networks is driven more by a lack of discovery ("Nothing") than by active rejection ("Dislike").
Critical Insights & Conclusion
This work highlights a critical leap in social media analytics: treating missing data as a behavioral signal rather than a technical error.
Takeaways for Practitioners:
- Context Matters: An interaction (or lack thereof) must be judged relative to the user's category density.
- Refining recommendation engines: By distinguishing between "Nothing" and "Dislike," algorithms can prioritize showing "Nothing" content (Discovery) while actively avoiding "Dislike" content.
Limitations: The current threshold () is a global mean, which might be too rigid. Future work could benefit from Latent Class Analysis to create more personalized behavioral clusters.