
SIGMA: Leveraging Cultural Algorithms to Navigate Urban Danger in Real-Time
Mobile Device to Measure Ubiquitous Danger in a Great City Based on Cultural Algorithms
The paper introduces SIGMA, a mobile geographic information system designed for Ciudad Juarez, utilizing Cultural Algorithms and Data Mining to calculate real-time insecurity indices. By integrating historical crime statistics with a user's GPS coordinates, the system provides a visual danger indicator via an Android application and Google Maps API.
TL;DR
In response to the extreme violence in Ciudad Juarez, researchers have developed SIGMA, a mobile-based intelligent system. By combining Cultural Algorithms and Data Mining, the app calculates an insecurity index based on your current GPS location and the time of day, providing a color-coded safety map that significantly outperforms traditional analysis in predicting and avoiding danger.
Context: A City Under Pressure
Between 2007 and 2010, Ciudad Juarez became one of the most dangerous cities globally due to organized crime. With homicide rates reaching 327 per 100,000 people, the need for technological intervention became a matter of survival. Traditional static maps couldn't account for the fact that a "safe" neighborhood at noon might become a "high-risk" zone at midnight.
The Core Challenge: Dynamic Insecurity
Most navigation tools focus on the "shortest path," ignoring the "safest path." This research addresses two critical gaps:
- Temporal Fluctuations: Crime is not distributed evenly across 24 hours.
- Adaptive Intelligence: How can a system "learn" from cultural and social data patterns rather than just raw database entries?
Methodology: High-Tech Security Modeling
The SIGMA system architecture is divided into a mobile client (Android) and a robust backend server.
1. Spatial Calculation (Haversine Formula)
To determine the risk radius around a user, the system employs the Haversine formula. This calculates the "great-circle distance" between the user's coordinates and known crime hotspots, ensuring accuracy even on the sphere-like surface of the Earth.
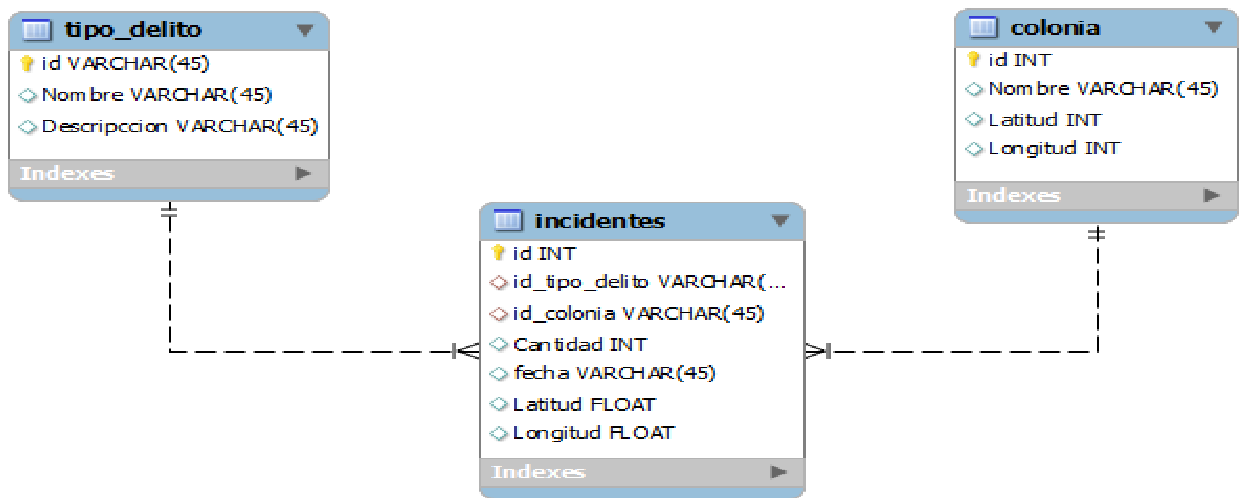 Figure 2: The relational database structure focusing on crime types, neighborhood geofencing, and incidents.
2. The Insecurity Index
Influenced by the UN’s Human Development Index (HDI), the authors developed a dual-component index:
- Component Q (Quantity): Normalized density of criminal events in a specific radius.
- Component H (Hour): The temporal risk factor, grouping incidents by the time of day.
3. Cultural Algorithms (The Intelligent Layer)
While Data Mining identifies patterns, Cultural Algorithms simulate the process of cultural evolution to optimize the search for "safety solutions." This allows the system to recommend not just "where to go" but "when to stay or leave" based on evolving environmental cues.
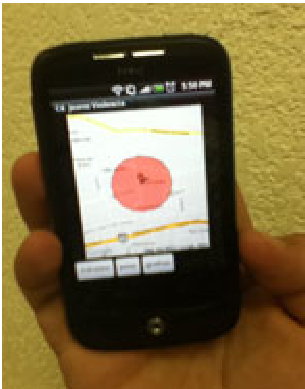 Figure 5: The Android interface displaying real-time insecurity levels through Google Maps integration.
Experimental Results: Proving the Value
The study evaluated the hybrid approach across multiple "époques" (time periods) to see how well it adapted to changing violence trends.
- VS. Random Action: The hybrid approach was 78% more effective in predicting/recommending safe actions.
- VS. Data Mining Only: The addition of Cultural Algorithms provided a 35% boost in the accuracy of safety recommendations.
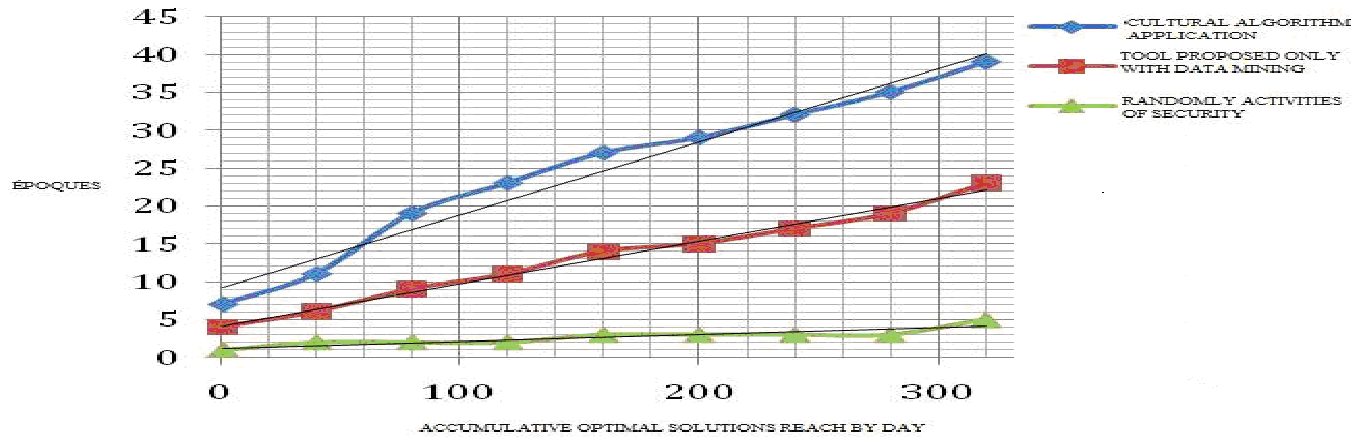 Figure 6: Trend analysis comparing hybrid intelligence against baseline models.
Critical Insight & Conclusion
The true value of this work lies in its Human-Centric Design. It doesn't just present data; it translates complex crime statistics into an 8-class color spectrum (from "Very Safe" to "Extreme Danger") that a user can understand in seconds.
Limitations: The model relies on the accuracy of public police records, which can be under-reported or delayed. Future Outlook: The authors envision an "Intelligent Diorama" where social networks can share real-time security updates among family members, creating a collective shield against urban violence. This technology has immediate transferability to other high-risk metropolises like Caracas or Rio de Janeiro.