
Mobile Phone Data vs. Traditional Surveys: A New Era for Japan’s Inter-regional Travel Analysis
Exploring Potential Use of Mobile Phone Data Resource to Analyze Inter-regional Travel Patterns in Japan
This study evaluates the potential of Mobile Phone Data (MOBI) as a cost-effective alternative to traditional on-site surveys for analyzing inter-regional travel in Japan. By comparing NTT DOCOMO's Mobile Spatial Statistics with the 2010 Net Passenger Transportation Survey (NPTS), the authors utilize Exhaustive CHAID decision trees to classify trip generation patterns.
TL;DR
Transportation planning is moving from "snapshot" surveys to "real-time" big data. This study benchmarks NTT DOCOMO's mobile data against Japan's official national survey (NPTS), revealing that while mobile data is excellent for tracking general urban flow, it requires careful calibration when analyzing long-distance travel and specific regional pairs.
Background & Motivation: The High Cost of Knowing Where We Go
In Japan, the Net Passenger Transportation Survey (NPTS) is the gold standard for infrastructure planning. However, it relies on on-site questionnaires that are remarkably expensive and slow to process. By the time the data is published, the world has often moved on.
The authors ask: Can we replace or supplement this with Mobile Phone Data (MOBI)? The promise is nearly real-time data at a fraction of the cost, but the challenge lies in the "noise"—the lack of demographic detail and the inherent bias of network provider coverage.
Methodology: Bridging Big Data and Statistical Rigor
The research utilizes two primary datasets:
- NPTS 2010: The "ground truth" reference.
- MOBI (2015): Data from NTT DOCOMO, covering over 70 million subscriptions.
The Deviation Index
To measure how far MOBI data drifts from the survey results, the authors introduced a Deviation Index: where is the survey value and is the mobile data value. This index allows for a normalized comparison between -1 and 1, highlighting where big data "misses the mark."
Classification via Exhaustive CHAID
Instead of simple regression, the authors used Exhaustive CHAID (Chi-square Automatic Interaction Detector) to build decision trees. This approach is superior for big data because it:
- Handles non-linear relationships without prior assumptions.
- Visualizes complex interactions between variables like "Rail Travel Cost" and "Tertiary Sector Workers."
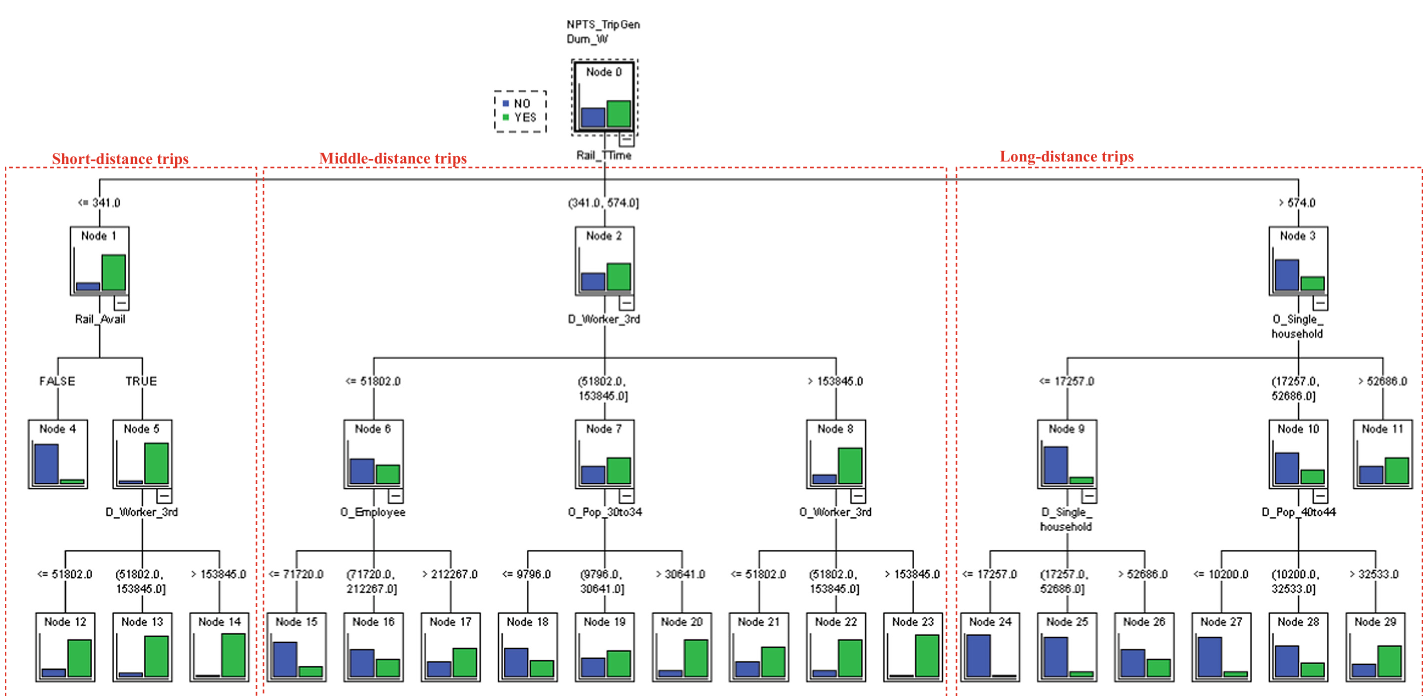 Figure 1: The NPTS decision tree shows that rail travel time is the primary predictor for trip generation.
Key Insights from the Data
1. The "Urbanized" Bias
The study found that MOBI data is highly accurate when looking at total trips leaving an origin or arriving at a destination (Correlations > 0.94). However, for specific OD pairs (e.g., traveling specifically from Zone A to Zone B), the correlation dropped to 0.602.
2. Over-estimation in Densely Inhabited Areas
Heat maps revealed a concentration of "red zones" around metropolitan areas like Tokyo and Osaka. MOBI data tends to capture significantly more movement in these areas than surveys, likely due to the higher density of cell towers and more frequent device "handshakes" in urban environments.
 (Note: Refer to Table 1 in the study showing r=0.602 for OD pairs vs r=0.96 for destination zones.)
3. Missing the Long-Distance Traveler
The CHAID analysis (Decision Trees) showed a stark difference in "Travel Patterns." While NPTS shows consistent trip generation across short and long distances, the MOBI data trip generation rate drops to nearly zero for long-distance nodes. This suggests that current mobile data algorithms might struggle to maintain "stay" continuity over long-distance routes.
Critical Analysis & Future Outlook
Takeaway for Planners
Mobile data is not yet a drop-in replacement for NPTS. It is an "Urban Pulse"—excellent for understanding day-to-day city dynamics but currently "blind" to certain long-distance travel nuances.
Limitations
A major hurdle in this study was the temporal gap: NPTS data was from 2010, while MOBI was from 2015. Japan's demographic shift in those five years could account for some of the deviation.
Future Work
The next logical step is integrating these datasets. By using the survey's demographic weightings to "calibrate" the raw mobile signals, researchers can create a hybrid model that offers both the precision of traditional surveys and the real-time agility of big data.