
Decoding the Digital Tie: Quantifying Social Closeness via Mobile Communication
Mobile Social Closeness and Communication Patterns
This paper introduces a quantitative model for measuring "Mobile Social Closeness" based on call frequency and duration. It proposes a grouping scheme that categorizes mobile contacts into three distinct tiers (Closest, Near, and Distant) and validates these through real-world call logs and human subject feedback.
TL;DR
How do you tell the difference between a call from your spouse and a call from a telemarketer using only metadata? This paper proposes a mathematical framework to quantify Mobile Social Closeness. By analyzing call frequency and duration, the authors categorize social circles into three tiers with 93.8% accuracy, proving that the closer we are to someone, the more our communication patterns synchronize.
Context: Beyond the Phone Book
In the era of hyper-connectivity, our phones are no longer just tools; they are sensors for our social lives. However, traditional mobile systems treat every contact in your phone book with equal "technical" weight. This paper bridge the gap between sociology and mobile computing by turning Granovetter’s "strength of weak ties" theory into a calculable Euclidean metric.
The Problem: The Intimacy Gap in Data
Prior work in social science identified that time and intensity are key to social ties, but quantifying this in a mobile environment is hard. People interact differently; some talk frequently but briefly, while others have rare but long "catch-up" sessions. Creating a universal "closeness index" that accounts for these variations—and does so asymmetrically (since you might value someone more than they value you)—was the missing piece.
Methodology: The Math of Intimacy
The authors define social closeness () as a distance from an "ideal" point of maximum connectivity (1,1).
- Normalization: Call frequency () and Duration () are normalized against the user's most active contact.
- Euclidean Mapping: Closeness is calculated as:
- Tiered Grouping: Using the mean values of these metrics, the system draws boundaries to create three groups:
- Group 1 (Closest): High frequency, high duration (Family/Best friends).
- Group 2 (Near): Lower frequency but high duration (Neighbors/Distant relatives).
- Group 3 (Distant): Low frequency, low duration (Telemarketers/Strangers).
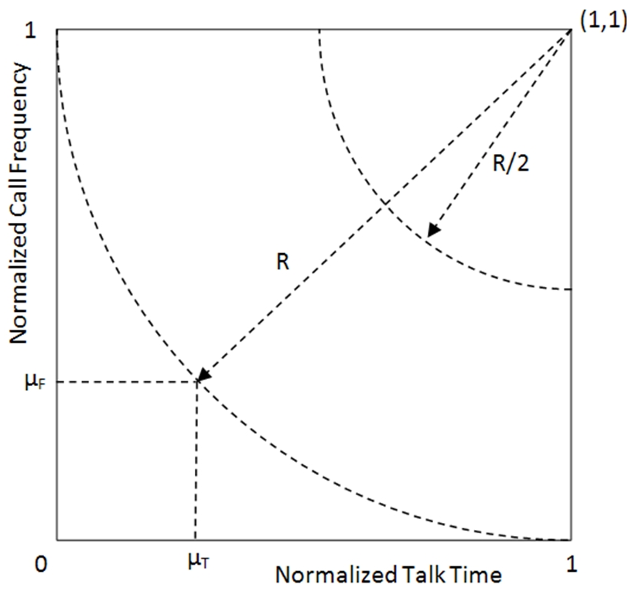 Figure 1: The geometric representation of social tiers based on normalized frequency and duration.
The Dynamic Nature of Ties
A key insight is that closeness is not static. The paper demonstrates Property 2: relationships evolve. A contact might shift from Group 1 to Group 2 over a 30-day period as communication fades, a phenomenon the model tracks accurately.
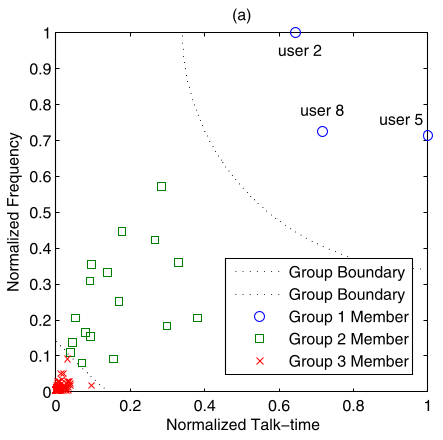 Figure 2: Tracking how a specific user shifts from the "Inner Circle" to a "Near Circle" over time.
Experiments: Pattern Similarity & Reciprocity
The study doesn't stop at grouping. It explores Calling Patterns—the "rhythm" of when we call people.
Using Gaussian kernel density estimators, the authors compared the "Incoming" vs "Outgoing" histograms. They found a striking correlation: The closer the relationship, the more similar the calling patterns.
- Group 1 Similarity: ~0.76 (You call them when they are likely to call you).
- Group 3 Similarity: ~0.12 (Almost no rhythm synchronization).
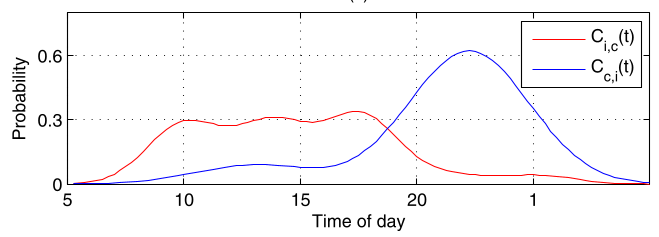 Figure 3: Comparison of calling rhythms (Probability vs Time of Day) across the three social groups.
Furthermore, Reciprocity (measured through interaction entropy) also scales with closeness. If you have a high "Interaction Ratio" and high frequency, you are almost certainly in Group 1.
Critical Analysis & Conclusion
Takeaway
The research successfully validates that "social tie" strength can be algorithmically derived with extremely high accuracy (93.8%). This has massive implications for Intelligent Interruption Management (allowing only "Group 1" calls during a meeting) and Social Recommendation Systems.
Limitations
A notable limitation, acknowledged by the authors, is the "Roommate Paradox": individuals you see face-to-face daily may have low mobile communication stats, leading the model to categorize them as "Group 2" despite high domestic intimacy.
Future Outlook
The next frontier is integrating this with Mobile Social Anthropology, comparing these digital groups to Dunbar’s Number and other psychological constructs of human social scaling.