
Driving and Posting: Deconstructing User Behavior in Vehicular Social Networks
Analysis of mobile user behavior in vehicular social networks
This paper presents a comprehensive analysis of mobile user behavior in Vehicular Social Networks (VSNs) using a real-world Waze dataset from Massachusetts. The researchers investigate how external factors like vehicle speed, transmission delays, and temporal patterns influence the frequency and reliability of user-generated traffic alerts.
TL;DR
By analyzing a week-long Waze dataset from Massachusetts, this study reveals that users are primarily "traffic-jam reporters" who participate most when they are stationary or moving slowly (under 30 km/h). The research identifies a critical "reliability trap": if an alert is delayed by the network or receives a low initial score, its perceived value rarely recovers, highlighting the heavy impact of external networking factors on crowd-sourced intelligence.
Problem & Motivation: The Dynamic VSN Challenge
Most social network research treats the user as an entity in a vacuum. However, in Vehicular Social Networks (VSNs), the user is also a driver dealing with intermittent connectivity and high-speed mobility. The authors argue that we cannot understand the data in these networks without understanding the external factors—speed and network delay—that influence why and how a user contributes.
The motivation is simple: if we know that information reliability is tied to the driver's speed or the time it takes to upload a post, we can build better algorithms to filter out "stale" or inaccurate traffic data.
Methodology: High-Resolution Data Analysis
The researchers utilized a public Waze dataset containing details such as anonymized User IDs, geographical coordinates, vehicle speed at the time of posting, and the critical Reliability Score (ranging from 5 to 10).
The study focused on five perspectives:
- Temporal Trends: Peak hours for contributions.
- Reliability Dynamics: How scores change over the lifetime of an alert.
- Kinematics: The impact of vehicle speed on the frequency of reports.
- Latency: The correlation between publication delay and data quality.
- User Loyalty: Patterns in how individual users return to the platform.
Core Insights: Speed, Delay, and Reliability
1. The 30 km/h Threshold
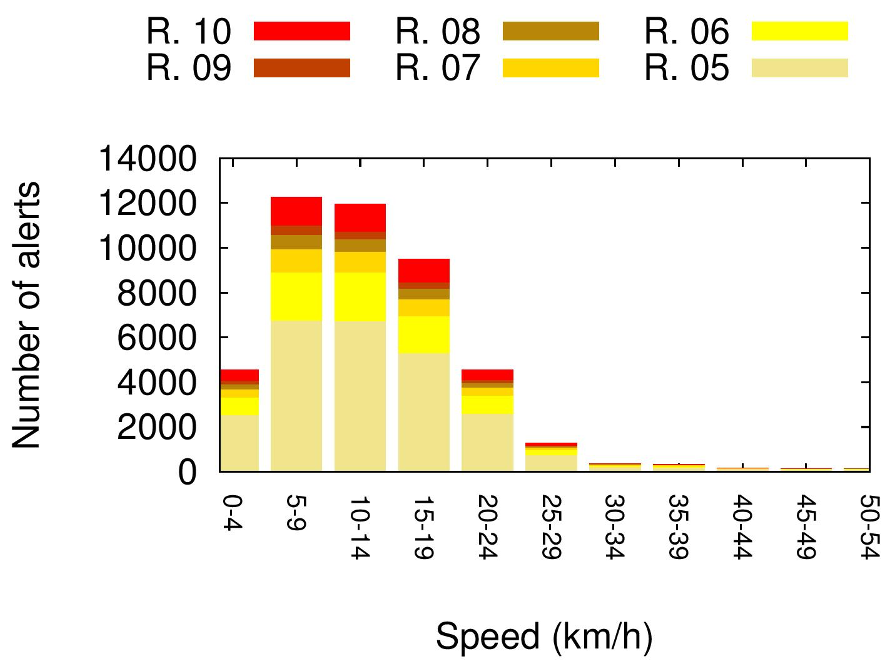
A striking finding is the relationship between speed and engagement. The data shows that users almost exclusively contribute when traffic is crawled. Once speeds exceed 30 km/h, the volume of alerts becomes negligible. This suggests that the "social" aspect of VSNs is a luxury of the stuck: users report traffic because they are currently stuck in it and have the cognitive bandwidth to interact with the app.
2. The Persistence of "Poor" Evaluations
The authors discovered a "bimodal" behavior in evaluations. Most posts start with a reliability score of 5 (the minimum). Surprisingly, these scores rarely improve. If a post is initially perceived as low-quality—perhaps due to a transmission delay that makes the alert "stale"—it stays low. Conversely, posts starting at 10 usually remain high.
3. Latency is the Enemy of Truth
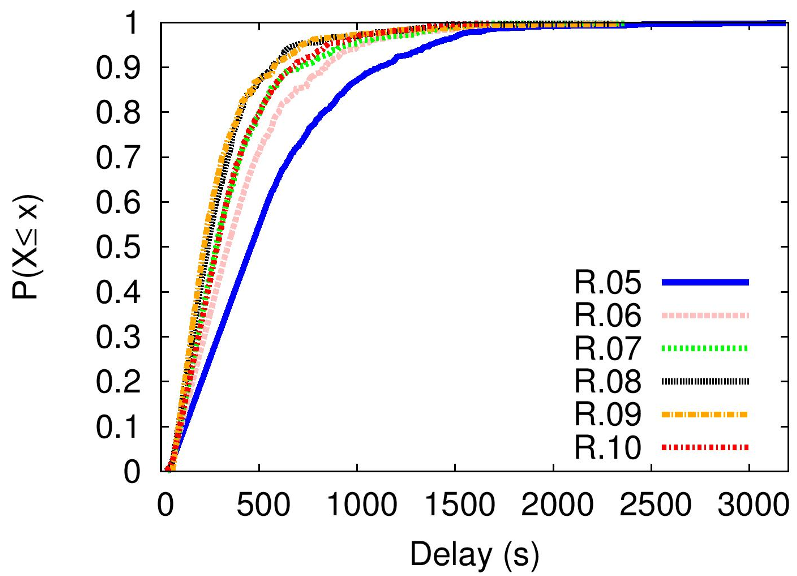
The study confirms a direct link between injection delay (the time between the event and its appearance on the network) and reliability. As delay increases, reliability scores plummet. This is intuitive: a "police spotted" or "pothole" alert is useless if it reaches the swarm after the event has cleared or the driver has already passed it.
Experimental Results: Rush Hour Dominance
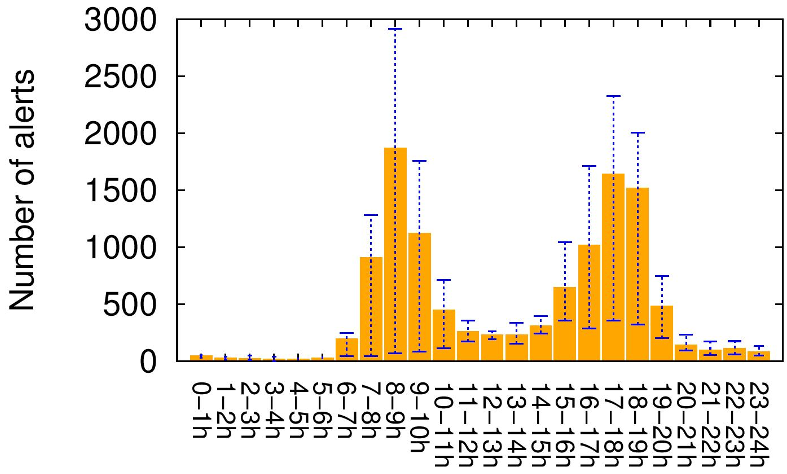
The data confirms that on weekdays, user activity follows the standard "M" curve of morning and evening rush hours (8-9h and 17-19h). On weekends, activity shifts to a broad afternoon peak. "Jams" are the most reported events, confirming that Waze is viewed primarily as a tool for collective traffic mitigation rather than general social interaction.
Critical Analysis & Future Outlook
Takeaway
This work demonstrates that VSN data is highly sensitive to the physical state of the vehicle (speed) and the technical performance of the network (delay).
Limitations
- Unit Uncertainty: The speed units were deduced rather than explicitly stated in the source metadata.
- Geographic Bias: Results are based solely on Massachusetts data; cultural differences in driving and social media usage might yield different results in other regions.
Future Work
The next step for this field is moving from descriptive analysis to predictive analysis. Can we use a user's current speed and historical reliability to "weight" their reports in real-time? This paper provides the empirical foundation to suggest that such weighting is not just possible, but necessary for accurate smart-city navigation.