
Synthesizing the Invisible: Generating Social Vehicle Mobility via Floating Car Data
Mobility Dataset Generation for Vehicular Social Networks Based on Floating Car Data
This paper proposes a systematic framework for generating large-scale social vehicle mobility datasets for Vehicular Social Networks (VSNs) by leveraging Floating Car Data (FCD) from taxis. The method combines urban functional area analysis with microscopic simulation using SUMO to reproduce 14 million trajectories within Beijing's 5th Ring Road.
TL;DR
The development of Vehicular Social Networks (VSNs) has long been bottlenecked by "data silence"—the inability to access private vehicle trajectories due to privacy concerns. This paper introduces a robust methodology to bridge this gap by using Floating Car Data (FCD) from taxis and Urban Functional Area analysis to synthesize realistic social vehicle datasets. Using Beijing as a case study, the authors generated 14 million trajectories that closely mirror real-world traffic dynamics.
The "Data Silence" Problem in VSNs
In the context of Smart Cities, vehicles are no longer just nodes in a VANET; they are social entities. However, while taxi (floating car) datasets are widely available, they represent a specific professional mobility pattern. Social vehicles (private cars) constitute the majority of urban traffic and exhibit different behaviors—commuting to schools, residential zones, and offices.
The core challenge is: How can we simulate the movement of millions of private cars if we can't track them?
Methodology: The Synthesis Pipeline
The authors propose a three-stage workflow to convert professional taxi data into a comprehensive social mobility map.
1. Demand Description (The Logic of Movement)
The research moves beyond simple GPS tracing by incorporating Urban Functional Areas. The city is divided into zones (Residential, Commercial, Diplomatic, etc.).
- Step A: Calculate the Traffic Volume and Absorptive Volume for each zone based on FCD.
- Step B: Apply the Gravity Model to predict the social vehicle OD Matrix.
- Step C: Refine the matrix using the Average Growth Factor Method to ensure iteration leads to a state that matches officially reported traffic ratios.
2. Network Description (The Physical Constraints)
Raw map data from OpenStreetMap (OSM) is often noisy. The authors manually corrected over 200 road segments and 5,520 traffic restrictions. This ensures that the simulation environment—the digital twin of Beijing—is topologically accurate, preventing artificial traffic jams caused by bad map data.
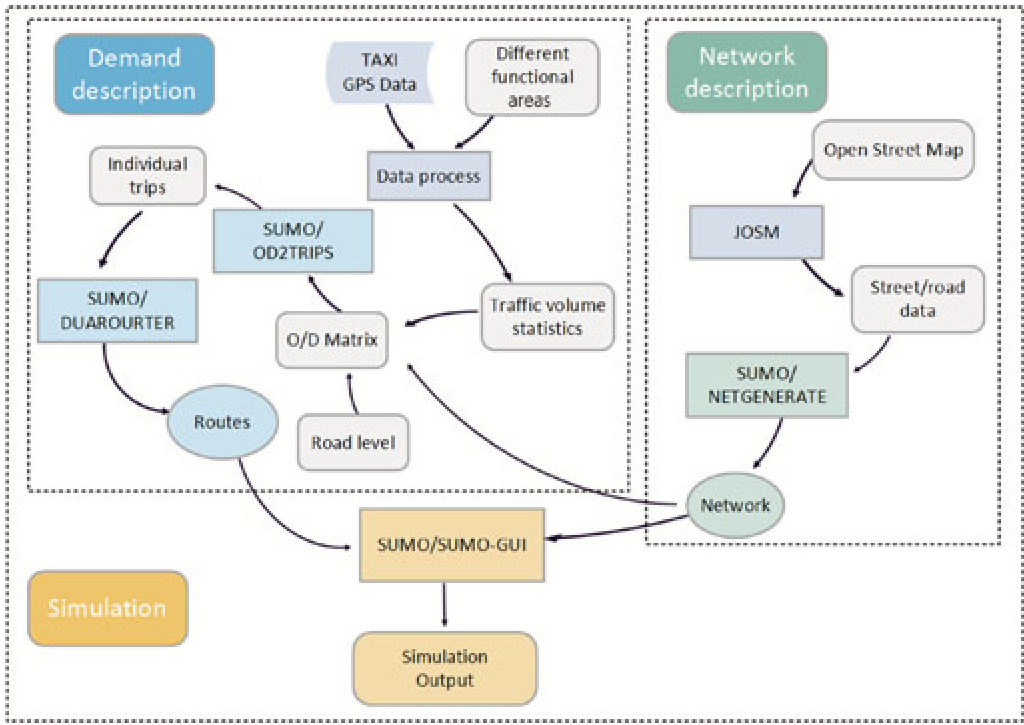 Figure: The proposed workflow for mobility dataset generation.
3. Microscopic Simulation
Using SUMO (Simulation of Urban Mobility), the synthesized OD Matrix is converted into individual vehicle trips. Unlike macroscopic models that view traffic as a fluid, this microscopic approach simulates every lane change and braking event.
Experimental Validation
The paper validates the model using a massive dataset: 12,000 taxis in Beijing producing 15GB of raw data across 30 days.
The model was tested across four critical time windows:
- Morning Peak (08:00–09:00)
- Noon Peak (12:00–13:00)
- Evening Peak (17:00–18:00)
- Night Traffic (22:00–23:00)
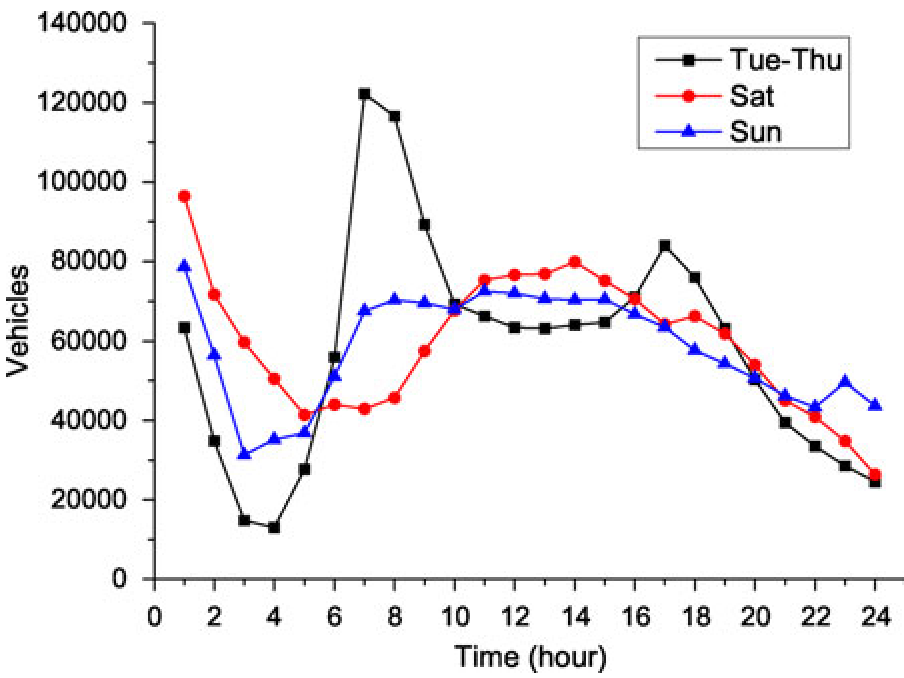 Figure: Speed distribution and congestion visualization across different time periods in Beijing.
Key Results:
- High Fidelity: Compared to Google Maps and official traffic reports, the simulation showed an 8.13% error rate in terms of outlier behaviors, meaning over 91% of the synthesized traffic matched reality.
- Functional Insight: The study confirmed that residential areas remain congested during most peak hours, while commercial district traffic spikes at night due to recreational social activities.
Critical Insight & Future Outlook
The brilliance of this work lies in its universality. As long as a city has a fleet of GPS-equipped taxis (FCD) and basic land-use data, this method can generate a "privacy-safe" digital twin of its private car mobility.
Limitations: The model currently struggles with unique nodes like airports or train stations where professional and private mobility patterns diverge significantly. Future improvements involving specific parking-lot data could refine these "hub" behaviors.
Conclusion
By treating taxis as a "sample" of human intent and urban functional areas as the "context," the authors have provided a scalable solution to the VSN data scarcity problem, paving the way for more realistic social-aware routing and urban planning simulations.