
Modeling Emotion Influence: How Your Friends' Photos Shape Your Mood
Modeling Emotion Influence in Image Social Networks
This paper explores "emotion influence" within image-based social networks like Flickr. The authors propose a probabilistic factor graph model that integrates visual content features, temporal user dynamics, and social correlations to identify how emotions spread between users and to predict user emotional states.
TL;DR
Can your friend's Flickr upload actually change your mood? This research proves that "emotion influence" exists in image-heavy social networks. By using a Factor Graph Model that combines visual aesthetics with social and temporal links, the authors achieved a 75% accuracy in predicting user emotions, significantly outperforming traditional methods like SVM. The study also reveals a striking psychological insight: negative emotions are more contagious than positive ones in digital spaces.
Problem & Motivation: Beyond the Text
Most sentiment analysis research focuses on text—words are easy to parse. However, images stimulate the mind 3,000 times faster than thought. In networks like Flickr or Instagram, the "vibe" isn't just in the captions; it's in the color palettes, the compositions, and the social interactions.
Prior work failed because it viewed images as isolated data points. But humans are social animals:
- Temporal Consistency: Your mood today is likely related to your mood yesterday.
- Social Contagion: If your circle uploads depressing imagery, your own emotional state is likely to shift.
The challenge lies in quantifying this "invisible" influence. How do we distinguish between a user who is naturally sad and a user who has been influenced by a friend's sadness?
Methodology: The Factor Graph Framework
The authors move beyond simple classification by building a Probabilistic Factor Graph. This isn't just a neural net; it’s a structured model that accounts for the physics of social interaction.
The Three Pillars of Influence:
- Content (Visual Features): Using 21-dimensional aesthetic features (Five-color combinations, saturation, etc.) to understand what an image feels like.
- Temporal Correlation: A decay function that recognizes emotions are stable in the short term but shift over weeks.
- Social Correlation: A mechanism to model "who influences whom," assuming that if a friend influenced you once, they are likely to keep doing so.
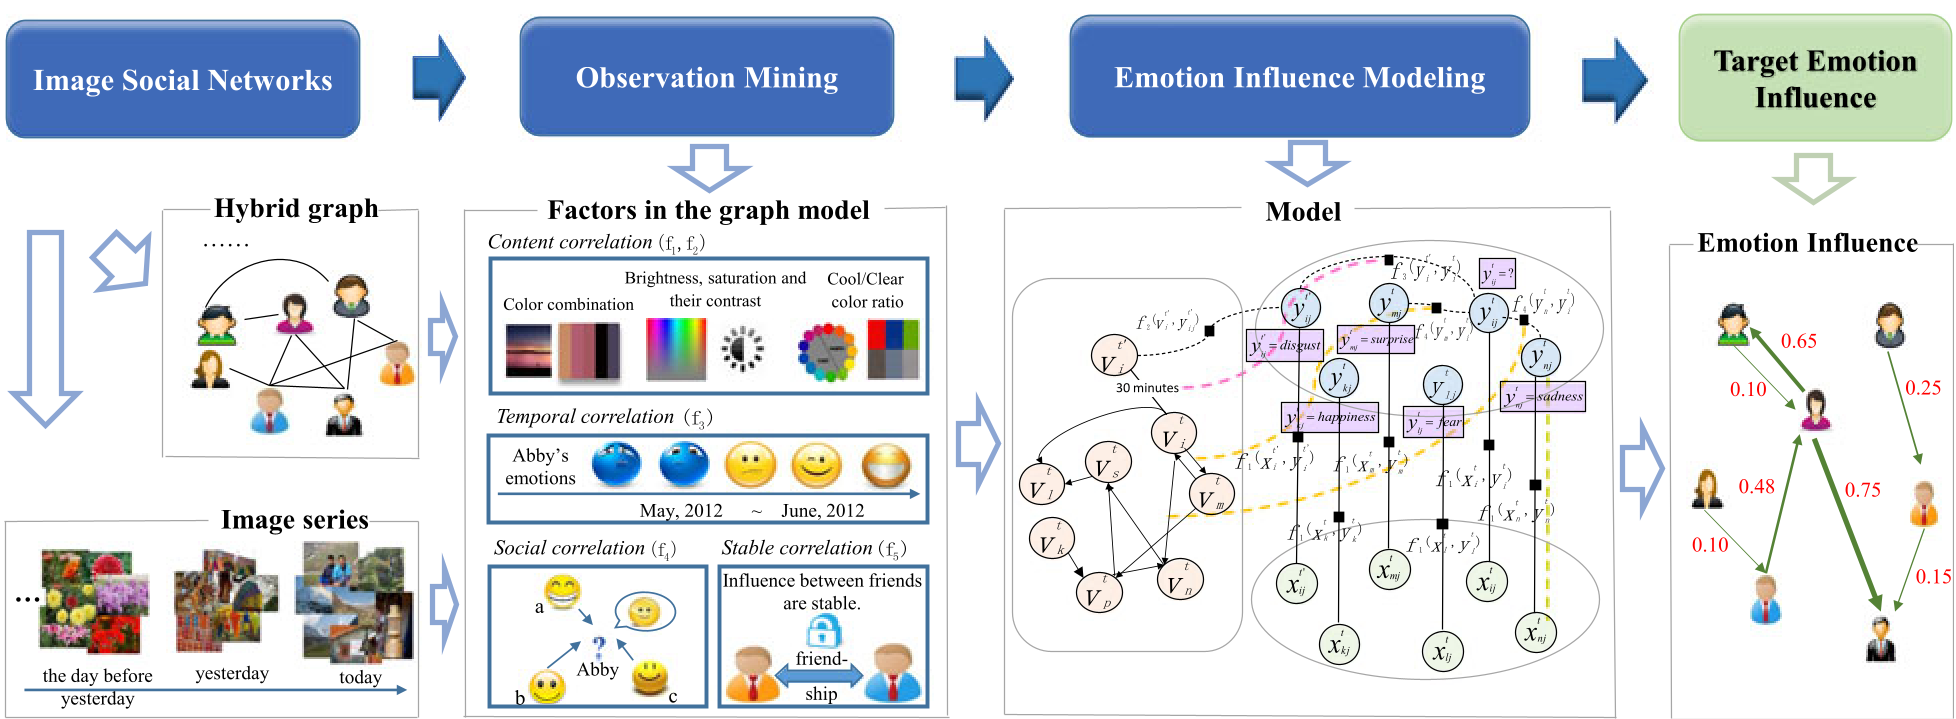 Figure 1: The general framework illustrating the flow from image social networks to learned emotion influence.
To learn the model, the authors use a hard EM algorithm. Since social networks are massive and influence is often a "latent" (hidden) variable, they employ Gibbs Sampling to approximate the complex gradients required for optimization.
Experiments: Proving the Connection
The study utilized a massive dataset of over 350,000 labeled images from Flickr. Ground truth was established using an automated synonym-expansion method (via WordNet and HowNet) to label images based on tags and comments.
Key Performance Metrics:
- Our Model: 75.0% Accuracy.
- Graph Model (Baseline): 72.0%.
- SVM: 71.5%.
- Naive Bayesian: 48.8% (effectively failing).
 Table 1: Accuracy comparison across different emotional categories.
The "Aha!" Moments:
- Negative Intensity: The model was particularly effective at identifying Anger and Disgust. This is because negative images often share similar visual "DNA" (cool, dull colors), making them hard for standard SVMs to separate. The social factor provides the "tie-breaker" needed for accuracy.
- The "Disgust" Exception: Interestingly, the study found that Disgust does not follow typical social patterns. While most emotions spread more as interactions increase, Disgust is highly subjective. A friend might find a spider "disgusting," while you find it "fascinating"—breaking the contagion loop.
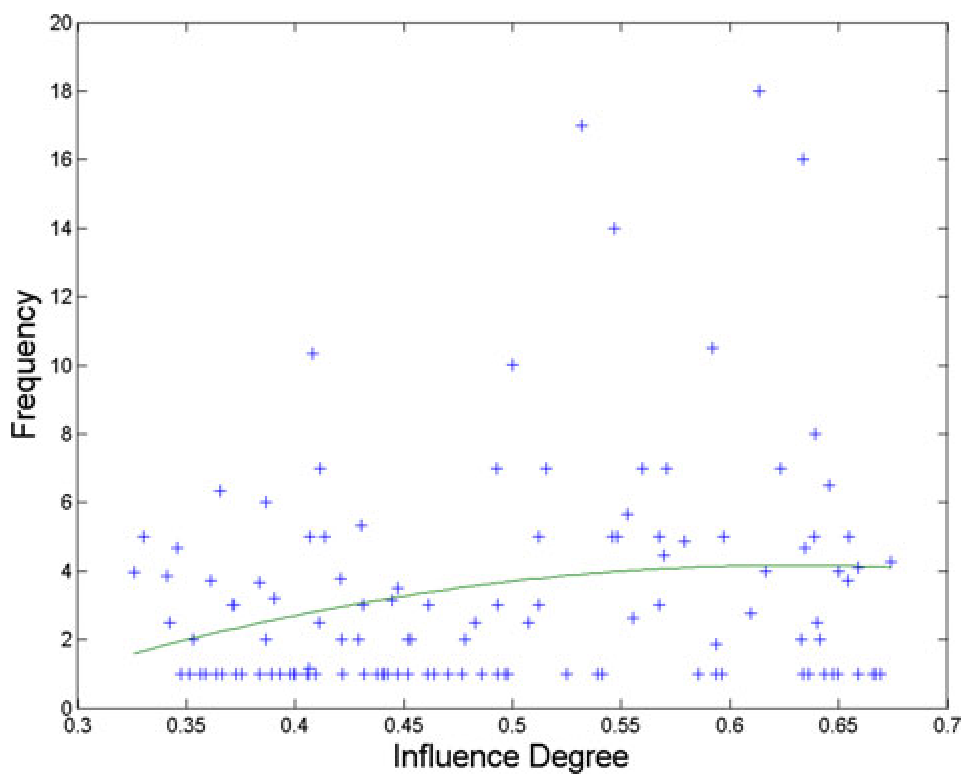 Figure 2: The correlation between interaction frequency and emotion influence.
Deep Insights & Future Outlook
The core takeaway is that context is king. Affective computing (AI that understands emotion) cannot rely on pixels alone. By observing the "stable correlation" (Factor f5), the researchers proved that digital influence isn't a one-off event; it's a persistent relationship.
Limitations & Future Work:
- Data Noise: Relying on user tags for ground truth is practical but imperfect.
- Group Conformity: The authors suggest the next step is looking at "Group Conformity"—how a whole community's vibe forces an individual's emotion to align.
Conclusion
This work transitions the field of image emotion analysis from static recognition to dynamic influence modeling. It provides a roadmap for developers building recommendation systems or social advertising: if you know how emotions spread, you can predict what a user wants to see tomorrow based on what their friends are feeling today.