
Smart Sampling: Why Your Social Circle is the Key to Efficient Voting
Modeling Spread of Preferences in Social Networks for Sampling-Based Preference Aggregation
This paper introduces a social-network-informed framework for representative-based preference aggregation, utilizing the <b>RPM-S</b> (Random Preferences Model - Sampling) to model preference distribution. By selecting a small subset of representative nodes, the authors achieve high-fidelity approximation of a population's collective preference across various voting rules.
TL;DR
Gathering preferences from an entire population is a logistical nightmare. This paper demonstrates that by leveraging the 1 underlying social network and the principle of homophily, we can select a tiny "representative" subset of nodes (voters) whose collective preference almost perfectly mirrors the whole group. The authors introduce the RPM-S model and greedy algorithms to minimize aggregation error, proving that social structure matters more for personal choices than for public policy.
The "Voter Apathy" Bottleneck
In an ideal world, every project initiative or product launch would be guided by the total consensus of the population. In reality, people are busy, uninformed, or simply uninterested.
The core research intuition here is that preferences are not distributed randomly. Because of homophily ("birds of a feather flock together"), your friends likely share your tastes. Most prior works either ignore this network structure or assume a "Random Polling" approach. However, random polling has high variance at small sample sizes—meaning you could accidentally pick a group that completely misrepresents the silent majority.
Methodology: Modeling the "Spread" of Desires
The authors move beyond simple influence diffusion. They model how preferences distribute across a graph using the Random Preferences Model (RPM).
1. The Preference Propagation Model
Instead of nodes "infecting" each other with a virus, nodes in this model share a Normalized Kendall-Tau distance distribution. If I know my friend's ranking of 5 alternatives, the model predicts my ranking based on our "tie strength" (historical similarity).
2. Greedy-min vs. Greedy-sum
How do you pick the best representatives?
- Greedy-min: This is the "cautious" approach. It picks nodes to ensure that even the most "lonely" or eccentric node in the network has a representative who is relatively similar to them.
- Greedy-sum: This is the "utilitarian" approach. It picks nodes that maximize the total similarity across the entire population.
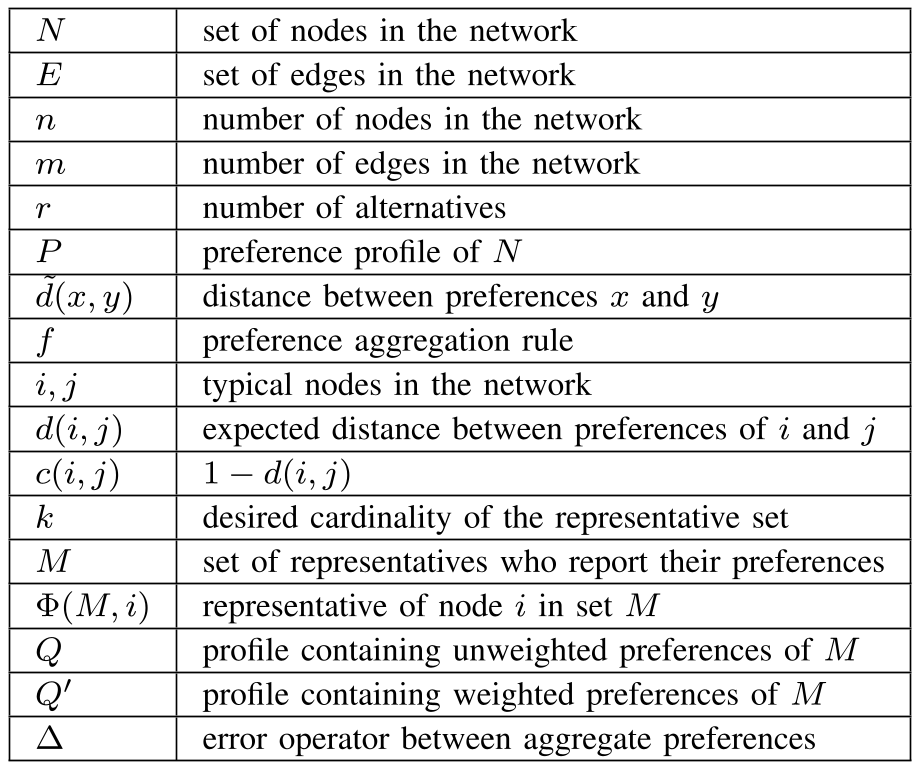 (Table II: Notation and variables defining the distance and similarity metrics within the network)
The Robustness Metric: Expected Weak Insensitivity
One of the paper's most elegant academic contributions is the Expected Weak Insensitivity property. It formally defines a "robust" voting rule: if small changes in individual preferences lead to only small changes in the final aggregate result, the rule is "insensitive." The authors prove that rules like Smith Set and Schulze satisfy this, providing a mathematical guarantee for the Greedy-min algorithm's performance.
Experimental Insights: Personal vs. Social Topics
The researchers built a custom Facebook app, "The Perfect Representer," to gather real preferences on 8 topics ranging from "Chatting Apps" (Personal) to "Government Investment" (Social).
Key Result: The "Media Effect"
- Personal Topics: Social network-based algorithms (Greedy-sum, Degree Centrality) crushed random polling. Your friends are excellent predictors of your lifestyle choices.
- Social Topics: Random polling performed surprisingly well. Why? Because external forces like mass media and national news act as a "global bias" that aligns preferences across the network, making the specific social structure less relevant.
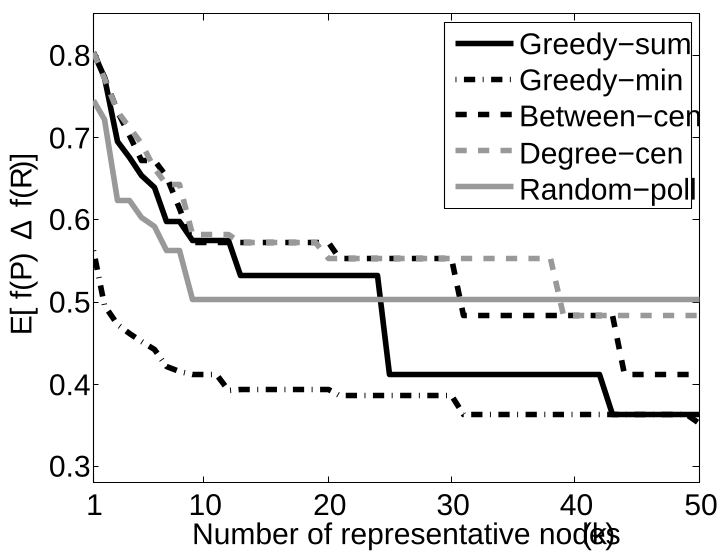 (Figure 3: Error plots showing that network-aware algorithms consistently keep error rates lower than random polling as k increases)
Critical Analysis & Conclusion
This work bridges the gap between Social Choice Theory and Network Science. It proves that the "cost" of democracy (gathering every vote) can be drastically reduced if we understand the topology of the voters.
Limitations: The model assumes tie strengths are known or can be inferred. In many private networks, this data is hidden. Furthermore, the model doesn't fully account for "strategic voting" where representatives might lie to push their own agenda.
Takeaway for the Future: For product designers and policymakers, the message is clear: if you are asking about personal lifestyle features, look at social clusters. If you are asking about broad public policy, a diverse random sample is your best bet.
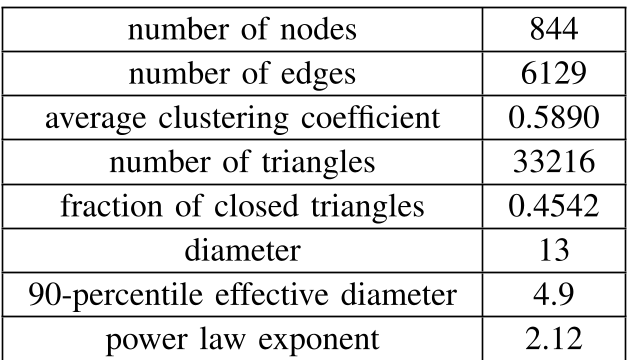 (Table I: Statistics of the Facebook dataset used to validate the homophily models)