
From Baskets to Networks: Reimagining Market Basket Analysis as a Social Web
Modeling a Store's Product Space as a Social Network
The paper proposes a novel approach to Market Basket Analysis by modeling product purchase data as a social network (Product Network). By applying community detection algorithms like modularity optimization, the authors identify clusters of related products, moving beyond traditional frequent itemset mining.
TL;DR
Market Basket Analysis (MBA) has long been dominated by association rules (e.g., "Beer implies Diapers"). This paper shifts the paradigm by treating products as nodes in a social network. By applying community detection and a novel utility metric, the authors reveal "influence zones" that allow retailers to identify highly profitable product clusters—like a baking community that boosts revenue by 85.5%—which traditional rules often obscure.
Background: Beyond the Association Rule Flood
For decades, the standard tool for retailers has been frequent itemset mining. However, if you've ever looked at a raw output of association rules, you know the pain: thousands of redundant, trivial, or statistically "noisy" rules. The core problem is that association rules are local and directional; they miss the global structure of how products cluster together.
The authors' insight is grounded in a simple analogy: Just as people form communities in a social network based on shared interests, products form communities based on shared "needs" or consumption contexts.
The Methodology: Constructing the Product Network
The researchers built their network using data from a University convenience store (2,200 products, 660k transactions).
- Node/Edge Definition: Every product is a node. An edge exists if two products are bought together.
- Noise Reduction: Product networks are notoriously dense and noisy (people buy random things together once). The authors established a minimum threshold () to prune spurious connections, similar to "support" in association rules.
- Community Detection: Utilizing the Louvain algorithm (Blondel et al.), they partitioned the network into disjoint subgraphs to maximize Modularity ()—the density of internal connections versus random chance.
Measuring What Matters: The Utility Metric
Not all communities are useful. A community of 500 products is too big to manage; a community of 2 products is just an association rule. To solve this, the authors proposed a Utility Measure ():
- Information (): The sum of conditional probabilities (confidence) within the group.
- Density (): Information per node.
- Utility (): The harmonic mean of and .
This formula creates a "sweet spot": it likes dense, highly-correlated clusters but favors larger ones if they maintain high density.
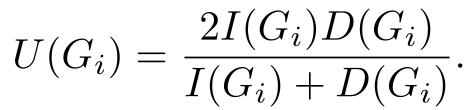 The Utility formula: Balancing community size and internal relationship strength.
Experimental Insights: Baking, Salsa, and Hidden Yogurt
The results from the Notre Dame convenience store were striking.
The "Baking Hub"
In a community of eggs and baking products, "Eggs" acted as a central hub. While eggs appear in many transactions, 39% of egg purchases included a neighbor from the baking community. Business Logic: By analyzing the expected additional sales from "Cake Mix," the store found it generates 2.30 is instant profit.
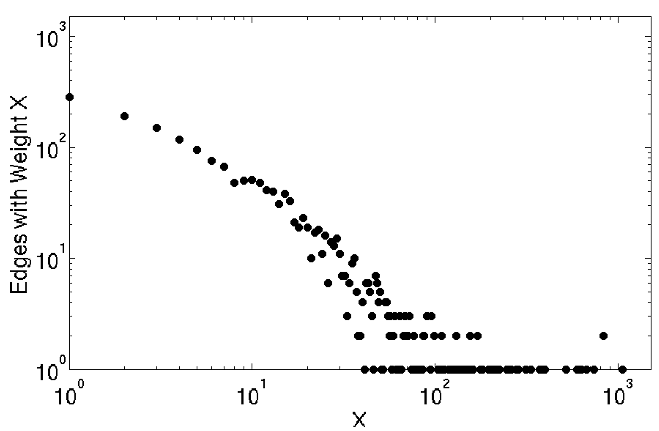 Figure 2(b): The Baking Community. Note how eggs function as the essential nexus for baking-related items.
The "Yogurt Obscurity"
The most interesting finding was a community of fruit, yogurt, and salad. Traditional association rules failed to rank "Fruit + Yogurt" highly because there are so many varieties of yogurt. Each individual yogurt-fruit rule looked weak. However, the Community Detection grouped all yogurts together, revealing that 10% of fruit sales (by value) are tied to the yogurt category—a massive insight hidden by product fragmentation.
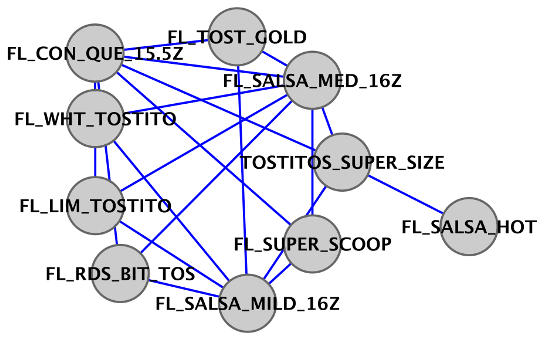 Figure 3(a): Chips and Salsa community. The bipartite structure clearly distinguishes between complements (chips + salsa) and substitutes (various flavors of chips).
Critical Analysis & Conclusion
This paper provides a refreshing structural view of retail data. By moving from rules (if A then B) to topology (A belongs to group X), it allows for a more "exploratory" style of data science.
Takeaways for the Industry:
- Complement vs. Substitute: The network structure visually distinguishes these. Complements connect to a central hub (like milk to many cereals); substitutes form isolated branches or sparse clusters.
- Strategic Layering: The authors recommend using Community Detection as the "First Pass" to identify macro-segments, followed by Association Rules to drill into the "Core" (popular items like coffee or bagels that are too dense for simple clustering).
Limitations: The network approach still struggles with the "dense core" of a store—universal items that everyone buys regardless of their specific mission. These "hubs" tend to pull unrelated products into giant, uninterpretable clusters. Future work using weighted modularity or hierarchical community detection may be needed to peel back the layers of these retail "super-hubs."