
Decoding the Pulse of the City: A Probabilistic Map of Urban Behavior
Modeling Urban Behavior by Mining Geotagged Social Data
The paper introduces a probabilistic sparse additive generative model (SAGE-based) to analyze urban behavior using Foursquare social data. It effectively decomposes cities into overlapping regions characterized by venue categories, user demographics, and temporal activity patterns, discovering similar functional zones across different global cities.
TL;DR
What defines a neighborhood? Is it the administrative boundary on a map, or the collective habits of its inhabitants? This paper presents a sophisticated probabilistic framework to mine Foursquare data, revealing that cities are more than just static grids—they are dynamic overlaps of activity. By using sparse generative models, the authors prove that "who" visits a venue is the strongest signal for defining urban character, outperforming location and time.
Background: Beyond the Grid
Urban computing typically treats cities as a collection of non-overlapping cells. However, urban reality is messy. A coffee shop in downtown San Francisco might be a professional hub at 9 AM and a social lounge at 8 PM. Prior works like Livehoods or Hoodsquare used spectral clustering or grid-based heuristics, which often require manual tuning of parameters like radius or granularity. This paper shifts the paradigm toward Probabilistic Generative Modeling, allowing the data to dictate the boundaries and importance of features.
Methodology: Sparsity and Overlap
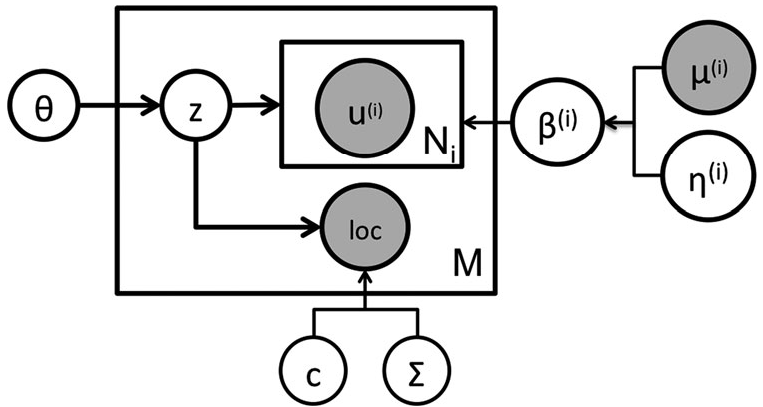
The core of the approach is a Sparse Additive Generative Model (SAGE). Unlike standard LDA, which can be noisy for sparse social data, SAGE models the log-probability of features as a deviation from a "global" city average.
The Generative Process
- Topic Selection: A venue is assigned a latent topic (region).
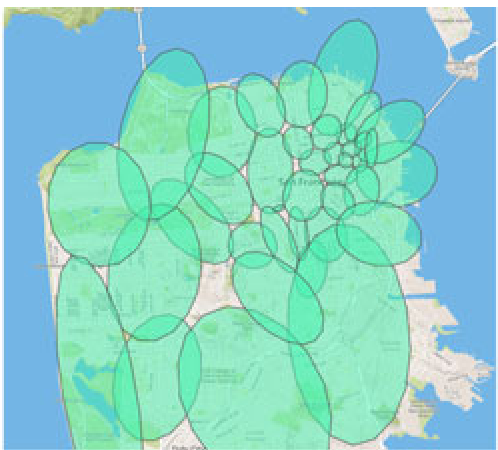
- Geographic Grounding: The location is generated from a bivariate Gaussian distribution unique to that topic.
- Feature Deviation: Categorical features (venue category, check-in time, day of week, and users) are generated. The model uses a parameter to penalize large deviations, ensuring that the model only "invents" a new characteristic for a region if there is enough evidence.
The "Super-User" Trick
With over 10,000 users per city, the user feature space is massive. The authors apply SVD (Singular Value Decomposition) to group users into "super-users" who frequent similar venues, reducing dimensionality to a manageable 1,000 without losing the semantic essence of social patterns.
Feature Importance: "Who" > "Where"
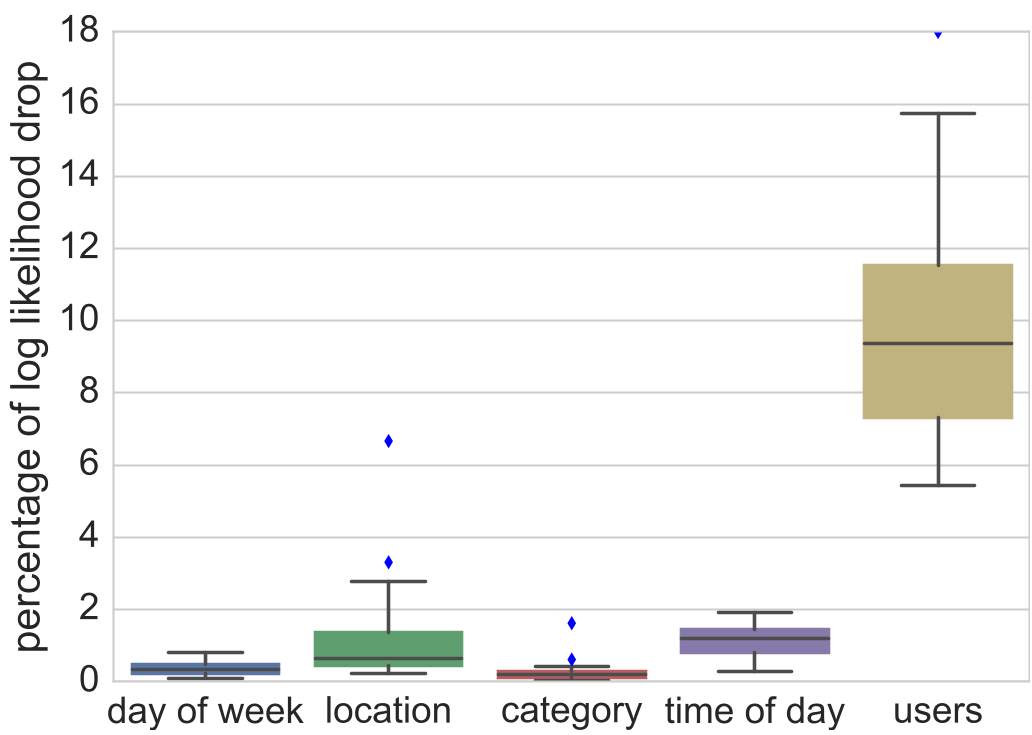
One of the most striking findings of the ablation study is the dominance of the User feature. By fixing specific features to zero and measuring the drop in log-likelihood, the authors found that knowing the identity of the visitors provides far more information about a region's distinctiveness than the venue's category or the timing of check-ins.
Cross-City Discovery: Finding the "Soho of Rome"
The authors proposed GeoExplore, a best-first search algorithm using a measure called jointsim. It finds regions in two different cities that not only share similar feature distributions (like a high density of artsy cafes) but also possess significant "probability mass" (importance) within their respective cities. For instance, they successfully matched the Mission District in San Francisco with parts of the West Village in New York based on venue usage patterns.
Performance & Comparison
The model was benchmarked against Livehoods, Hoodsquare, and SOM (Self-Organizing Maps).
- Predictive Power: Higher log-likelihood per venue on held-out test data.
- Distinctiveness: Lower mean entropy in categories, meaning the regions found by this model have much sharper "identities" than human-labeled or grid-based alternatives.
Critical Analysis & Future Outlook
The strength of this work lies in its unsupervised nature—it discovers urban structure without needing administrative ground truths, which are often outdated or arbitrary.
Limitations:
- LBSN Bias: Foursquare users are not representative of the total population; they tend to be younger and more tech-savvy.
- Gaussian Assumption: Using bivariate Gaussians assumes regions are elliptical. In reality, urban boundaries often follow jagged rivers or transit lines.
Future Work: Incorporating hierarchical regions (neighborhoods within districts) and tracking how these topics evolve seasonally would provide even deeper insights into the "metabolism" of our cities.
Conclusion
This paper moves urban computing from simple "clustering" to "modeling." It validates the intuition that a city is not just a collection of buildings, but a social tapestry where the most important thread is the people who walk its streets.