
Modeling Social Network Evolution: The Graph Differential Tuple Approach
Modelling Social Network Evolution
This paper introduces a novel framework for modeling the evolution of social networks using the "Graph Differential Tuple." By explicitly defining sets of added/removed nodes and edges alongside weight changes, the authors provide a structured approach to measuring dynamic graph distances across temporal snapshots or layers.
TL;DR
Understanding how social networks change over time is more critical than analyzing a static "freeze-frame." This paper introduces the Graph Differential Tuple, a systematic way to decompose the evolution between two graph states into added/removed components and weight shifts. By applying dedicated distance measures to this tuple, researchers can quantify the "speed" and "direction" of network evolution with mathematical precision.
Background & Motivation: The Static Trap
In the study of IT user activities and social platforms, networks are rarely still. Most current methodologies struggle with Temporal Dynamics—the fact that nodes (users) and edges (interactions) appear and vanish constantly. While classical concepts like Graph Edit Distance exist, they often fail to capture the specific nature of social evolution—such as the strengthening or weakening of existing ties (weights).
The authors' intuition is simple but powerful: To understand evolution, we shouldn't just compare two graphs; we should compute the delta between them and treat that delta as a first-class mathematical object.
Methodology: The Graph Differential Tuple
The core contribution is the Graph Differential Tuple. Instead of a single similarity score, the evolution is broken down into five distinct sets:
- V+ / V-: Vertices added or removed.
- E+ / E-: Edges added or removed.
- Δ: Modulo changes in edge weights.
Mathematizing Graph Distance
To convert this tuple into a actionable metric, the authors propose several measures, most notably the Sum Distance (d^s) and Normalized Sum (d^n).

The beauty of these formulas lies in the coefficients (α, β, γ). These allow researchers to weight different types of changes. For instance, in a corporate social network, a new employee (new node) might be more significant for evolution analysis than a single message (weight change) between existing colleagues.
Case Study: Evolution in Action
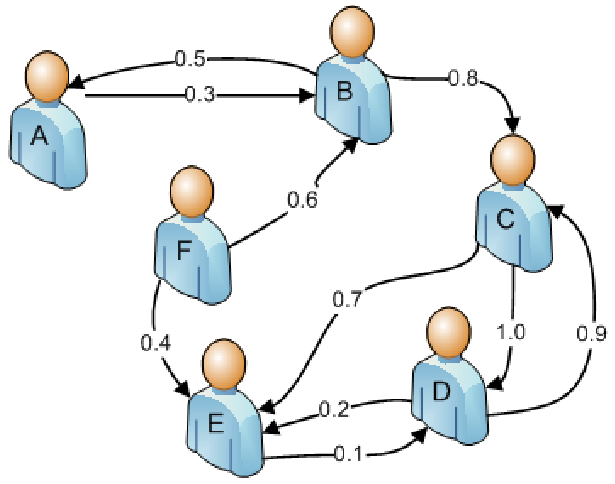
The paper demonstrates the concept by comparing two snapshots of a network. The transformation from G1 to G2 involves the removal of edges like (C,D) and the addition of new nodes like G.

By visualizing G2, we see a more fragmented structure compared to G1, a change that the Graph Differential Tuple captures not just visually, but as a formatted set of instructions required to transform G1 into G2.
Critical Insight & Future Outlook
The primary value of this work is its computational efficiency and interpretability. Unlike black-box graph embeddings, the Differential Tuple explicitly tells you what changed.
Key Takeaways:
- Granularity: By separating node changes from weight changes, it becomes possible to identify different types of evolution (e.g., expansion vs. intensification).
- Multi-layered Applicability: This framework is perfectly suited for multi-layered networks where one might compare the "Email Layer" vs. the "Instant Messaging Layer" within the same timeframe.
Limitations & Future Work:
The current approach assumes we can accurately map node IDs between snapshots (the Correspondence Problem). Future iterations will need to address how these measures perform under high-noise environments or in extremely dense graphs where the differential tuple might become as large as the graphs themselves.
The ultimate goal? Using these measures to detect anomalies—sudden spikes in graph distance that could indicate a platform's decline or a massive influx of new users.