
Decoding Market Pulse: Can Twitter Emoticons Predict the Stock Market?
Modelling Movement of Stock Market Indexes with Data from Emoticons of Twitter Users
The paper investigates the use of Twitter emoticons as a proxy for social mood to predict movements in the DJIA and S&P500 stock indices. By analyzing 1.6 billion tweets, the authors employed Support Vector Machines (SVM), Neural Networks, and Random Forests to achieve a prediction accuracy of 59.69% for the S&P500.
Executive Summary
TL;DR: This research demonstrates that the collective "mood" expressed through simple Twitter emoticons can significantly enhance the accuracy of stock market index predictions. By analyzing 1.6 billion tweets, researchers found that adding emoticon frequency data improved S&P500 movement forecasts to nearly 60%, outperforming baseline models that rely solely on historical price data.
Positioning: This work falls under the umbrella of Behavioral Finance, specifically exploring the "Social Mood" hypothesis. It moves away from complex lexical (word-based) sentiment analysis to focus on the more universal and computationally efficient signal of emoticons.
Problem & Motivation: The Noise in the Text
Predicting the stock market is notoriously difficult due to the "Efficient Market Hypothesis." While previous studies have used Twitter sentiment, they often rely on sophisticated Natural Language Processing (NLP) to parse words. However, words are prone to sarcasm, context shifts, and language barriers.
The authors' insight was simple: Emoticons are high-signal, low-noise indicators of emotion. If society is collectively "happy" or "sad," does that emotional energy translate into market optimism or pessimism? The researchers sought to validate if this simple metric could bypass the complexities of word-based analysis while still providing a predictive edge.
Methodology: From Tweets to Trends
The study processed an massive dataset of 1.6 billion tweets over a 15-month period.
- Feature Extraction: The team calculated the "Normalized Frequency" of 12 common emoticons (e.g.,
:),:(,:-D). - Dataset Construction: They compared a Basic Dataset (historical prices: Open, Close, High, Low, Volume) against an Emoticons Dataset (Basic + Emoticon frequencies).
- Modeling: They tested three heavyweights of machine learning: Support Vector Machines (SVM), Neural Networks, and Random Forests.
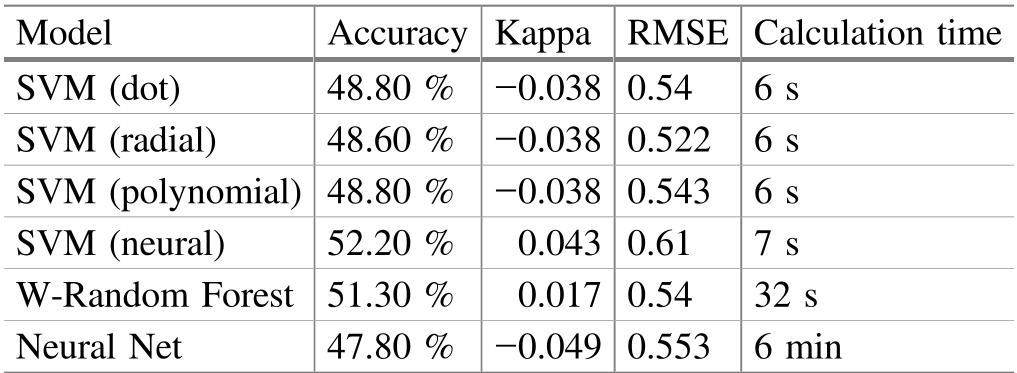 Table 1: Baseline performance of various ML models using only historical data.
Experiments & Results: The Two-Day Lag Secret
The most striking finding was the impact of Time Lags. The market doesn't always react instantly; emotions need time to percolate into trading decisions.
- S&P500 Breakthrough: Using an SVM with a 2-day lag, the researchers boosted accuracy from 50.70% to 59.69%.
- DJIA Findings: Similar results were seen for the Dow Jones, where a 2-day lag yielded 57.59% accuracy.
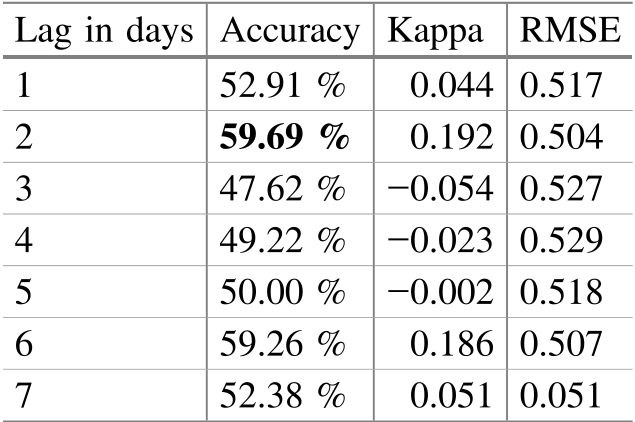 Table 3: Accuracy of S&P500 predictions across different day lags using emoticon data.
The "Emotional Paradox"
A fascinating discovery was the 0.965 correlation between happy :) and sad :( emoticons.
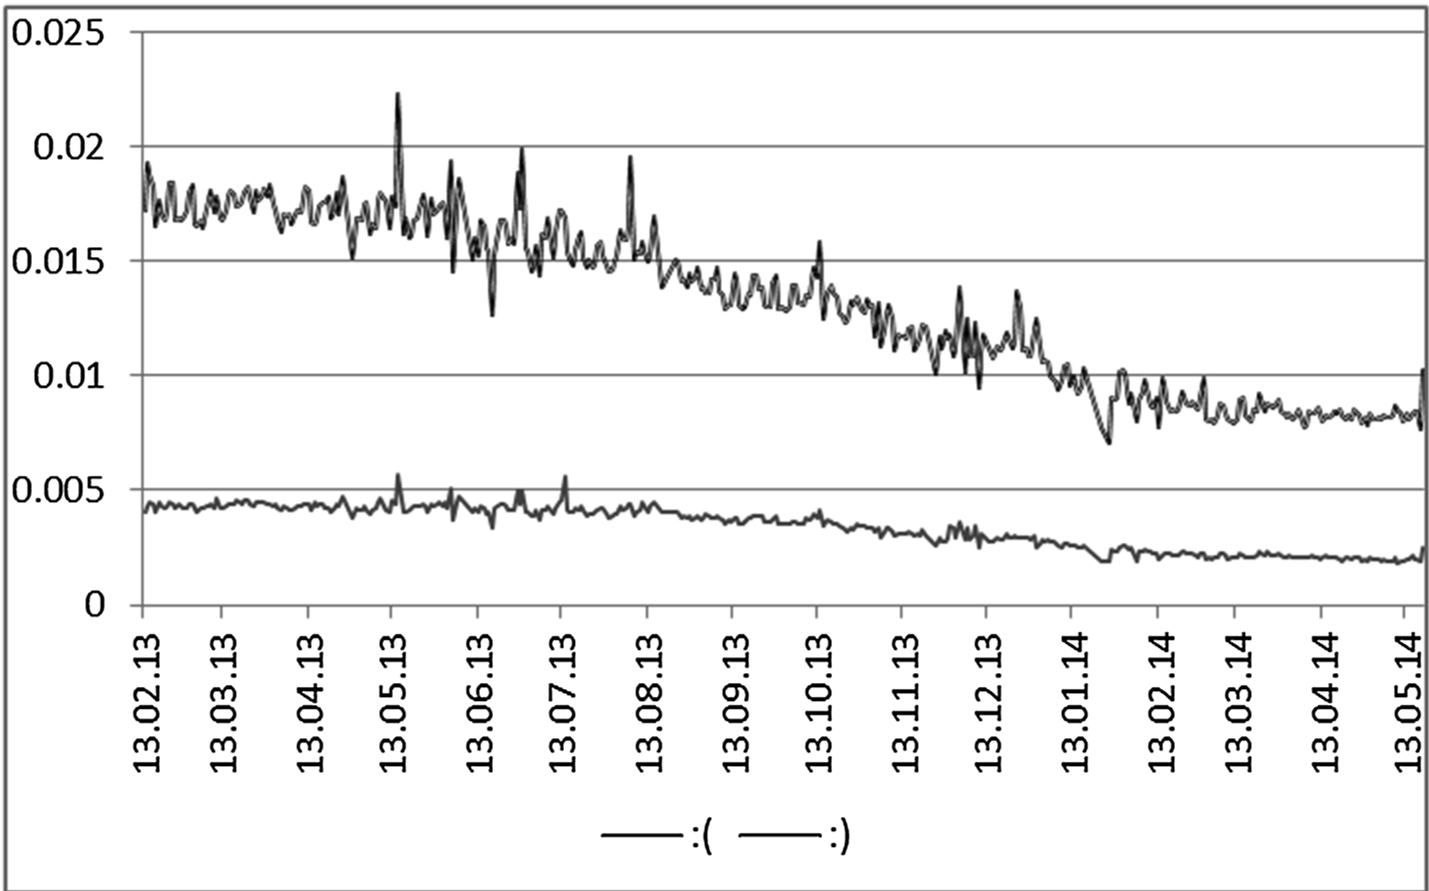 Figure 1: The synchronized fluctuation of positive and negative emotions.
This high correlation suggests that Twitter users don't just shift from happy to sad; rather, overall emotional intensity rises and falls. In periods of high social activity, both types of emoticons spike, indicating that "Public Emotionality" itself might be the real driver behind market shifts.
Critical Analysis & Conclusion
Takeaway: Emoticons are a viable, parsimonious data source for financial forecasting. They provide a "macro" view of public sentiment that is harder to capture with traditional financial metrics.
Limitations:
- Accuracy vs. Profit: A 60% accuracy is statistically significant but does not guarantee a profitable trading strategy after accounting for transaction costs.
- Lag Instability: The "best" lag (2 days vs. 5 days in previous studies) appears to change over time, suggesting that the speed of information reflection in the market is evolving.
Future Outlook: The authors suggest that the future of this field lies in Hybrid Models—combining lexical sentiment, emoticon frequency, and social media volume to create a multi-dimensional "Mood Index" for the digital age.