
Precise Agro-climatic Mapping: Bridging Geo-Spatial Mining and Plant Ecology
Models of regional agro-climatic resources survey and system assessment based on geo-spatial data mining
This paper presents a spatial data mining framework for surveying and assessing regional agro-climatic resources in Fujian Province. It proposes a Trend-surface with Residual (TSR) model integrated with Fuzzy Mathematics and Factor Analysis to achieve high-precision grid-level resource evaluation.
TL;DR
This study proposes a robust methodology to transform discrete weather station data into continuous, high-resolution (0.004° grid) agro-climatic maps for Fujian Province. By combining Trend-surface Analysis (TSR) for spatial estimation with Fuzzy Mathematics and Factor Analysis for ecological assessment, the author provides a "digital twin" of regional agricultural potential that captures both macro-trends and micro-climatic nuances.
Motivation: The Gap in Spatial Climate Data
Agricultural planning relies heavily on heat, moisture, and sunshine data. However, weather stations are point-based and discrete. This leaves researchers with two critical questions:
- How do we accurately predict climate data for the "in-between" areas where no sensors exist?
- How do we translate raw numbers (e.g., °C or mm of rain) into a unified "suitability" score that reflects biological reality?
Existing linear models often fail to capture the undulating nature of geographical terrain, while simple averaging ignores the non-linear impact of climate on crop growth.
Methodology: The TSR-Fuzzy Framework
1. Spatial Estimation: Macro vs. Micro
The author adopts a dual-layer approach to fill the "no data" gaps:
- Macro-level (Trend-surface): Uses 2nd-order polynomial equations to model how indicators vary with latitude (), longitude (), and altitude ().
- Micro-level (Residual Correction): Since macro-equations cannot account for local slope or vegetation, the Inverse Distance Square Weighted (IDSW) method is used to interpolate residuals () from nearby stations, leading to the final TSR (Trend-surface with Residual) value.
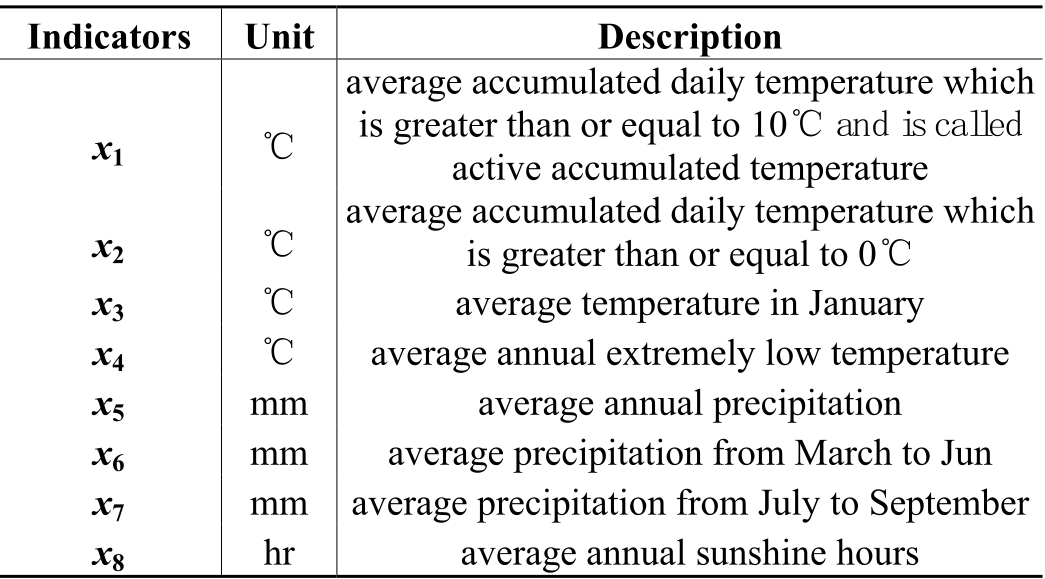 Table 1: The 8 core heat, moisture, and sunshine indicators used for the Fujian model.
2. Ecological Suitability via Fuzzy Logic
To solve the assessment problem, the author introduces Agro-climatic Suitability . Instead of saying "15°C is good," the model uses membership functions (values between 0 and 1) to define how "suitable" a value is for specific plant biomes. For instance, the active accumulated temperature () is mapped to a curve where 7500°C represents peak suitability (1.0).
3. Factor Analysis for Objective Weighting
Not all climate factors are equal. Using Factor Analysis (Varimax Normalized), the author calculated weights for heat (A1: 0.519), moisture (A2: 0.393), and sunshine (A3: 0.088). This ensures the final assessment isn't skewed by redundant variables.
 Table 2: Communality values () derived via Factor Analysis to determine the significance of each indicator.
Experiments and Results
The TSR equations reached a reliability level of 0.0001, significantly higher than the standard 0.01 threshold. By applying these models to a Digital Elevation Model (DEM), the study produced highly granular maps.
One of the most valuable outputs is the Dryness Index (K) map, which combines temperature and precipitation to show the actual water-stress levels across the province.
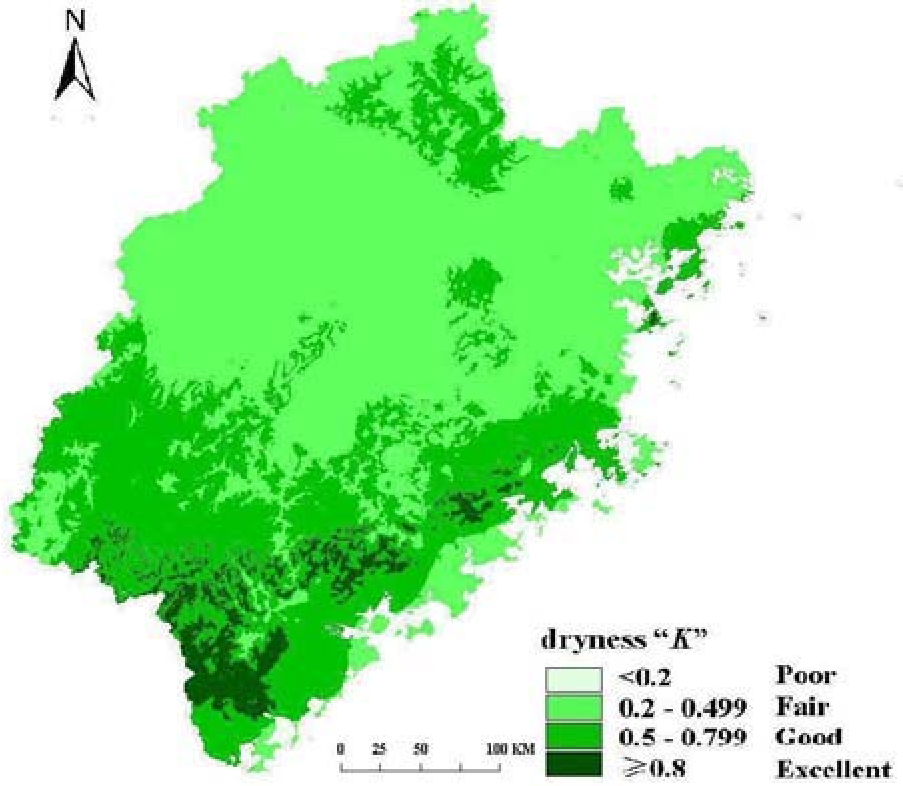 Fig 1: Spatial distribution of dryness "K" at the grid level, showing clear regional differentiation.
The model also generates a Utilization Coefficient (W), which measures how well the different climatic elements (heat, rain, sun) "cooperate" in a specific location.
Critical Insight: Why This Matters
The brilliance of this work lies in its Inductive Bias. By forcing the model to consider the physical relationship between coordinates and altitude (via the TSR equations) and then applying a biological lens (via Fuzzy Logic), the author moves beyond mere "data fitting" toward "process simulation."
Limitations & Future Work
- Crop Specificity: The current membership functions are generalized for Fujian's main crops. Future iterations need "targeted ecological spectrums" for specific high-value crops like Oolong tea or pomelo.
- Scale: While effective at the provincial level, the author notes that sub-county assessments would require even finer local data to account for micro-relief.
Conclusion
This paper provides a robust mathematical blueprint for regional agricultural assessment. By treating climate as a complex system rather than a set of isolated variables, it empowers policymakers to make evidence-based decisions on crop distribution and regional planning.