
Money on the Move: Decoding Regional Boundaries through the Lens of Big Data Transactions
Money on the Move: Big Data of Bank Card Transactions as the New Proxy for Human Mobility Patterns and Regional Delineation. The Case of Residents and Foreign Visitors in Spain
The paper introduces bank card transaction data as a novel proxy for human mobility and regional delineation. Using a dataset from Spain's BBVA bank, the authors employ modularity-based community detection to uncover geographically cohesive regions and apply gravity models to quantify mobility patterns across different nationalities.
TL;DR
Researchers from MIT and the University of Salzburg have demonstrated that your spending habits do more than affect your bank balance—they redraw the map. By analyzing millions of bank card transactions in Spain, this study proves that "economic footprints" are a superior proxy for defining regional boundaries and understanding the distinct mobility behaviors of domestic residents versus global tourists.
Problem & Motivation: Beyond the Phone Call
For decades, geographers have used phone records (CDRs) to understand how people move and interact. While effective, CDRs have a "blind spot": they primarily capture the behavior of residents with local SIM cards and ignore the purely economic motivations behind movement.
The authors argue that economic activity is a fundamental driver of human mobility. Does a resident of a small town travel to the nearest city for groceries, or to a distant capital for luxury goods? Does a tourist from France explore Spain differently than a tourist from Japan? Understanding these nuances is critical for infrastructure planning, retail placement, and the multi-billion dollar tourism industry.
Methodology: Mapping the Flow of Money
The researchers utilized a massive dataset from BBVA (Spain’s second-largest bank), covering 178 million transactions from 4.5 million residents and 166 million transactions from foreign visitors.
1. Network Construction
The paper introduces two sophisticated ways to build a mobility network:
- Money Flow Network: An edge is created between a customer's home region and the location of their purchase.
- Probabilistic Mobility Network: This novel approach calculates the probability that a customer visits location B after location A. This is particularly useful for tourists whose home "base" is outside the country.
2. Community Detection
Using a high-performance modularity optimization algorithm (an evolution of the Louvain method), the researchers grouped 368 small administrative units (comarcas) into larger communities based purely on the strength of their economic ties.
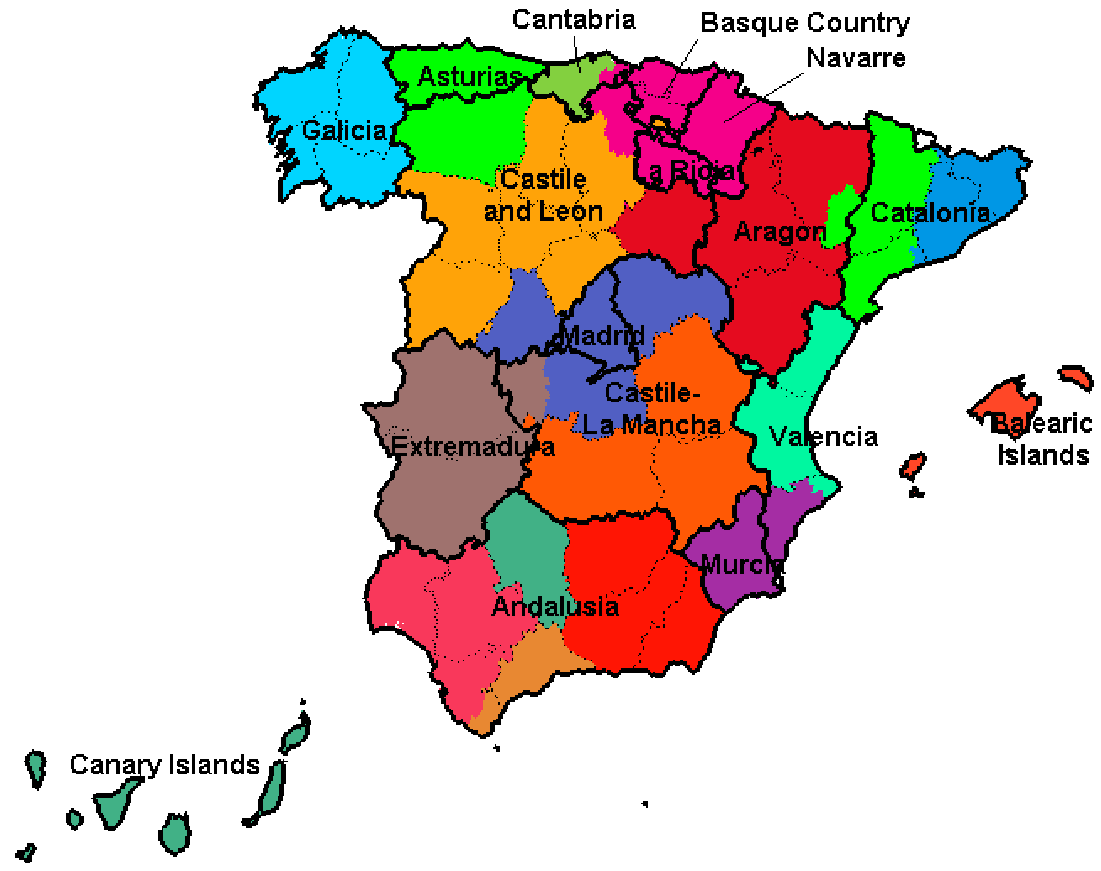 Figure 1: Optimal partitioning of money flow for residents, showing 19 communities that largely mirror official Spanish autonomous communities.
Experiments & Results: Residents vs. Tourists
The findings reveal a fascinating "dual reality" of Spanish geography.
The Domestic View: Socioeconomic Divides
For Spanish residents, the economic network mostly respects administrative borders. However, a "bi-partition" (splitting the country into just two halves) revealed a stark North-South divide, aligning with national statistics on unemployment and education.
The Tourist View: The Mediterranean Arch
For foreign visitors, the map looks entirely different. They ignore administrative borders in favor of "thematic" regions. The bi-partition for tourists separates the Mediterranean Arch (sun and beach tourism) from the rest of the country.
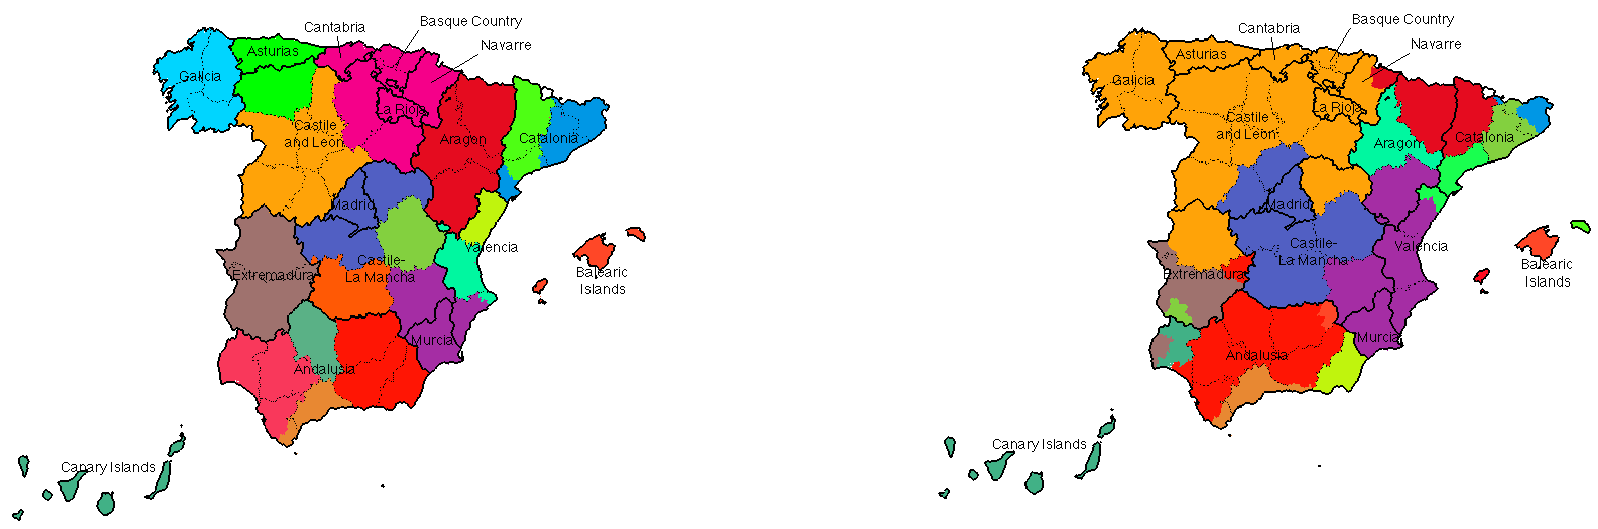 Figure 2: Comparing domestic (left) and foreign (right) mobility patterns. Note how tourists aggregate the north-west into one large, less-traversed block.
The Gravity Model of Nationalities
The researchers applied a Gravity Model to quantify how distance affects these visits. A key discovery was the "Distance to Origin" effect:
- Nearby Neighbors (e.g., France, Portugal): Exhibit "local" behavior, exploring smaller towns and staying within tighter clusters.
- Distant Visitors (e.g., USA, China): Show "hub-and-spoke" behavior, focusing exclusively on major nodes like Madrid and Barcelona and traveling longer distances within the country.
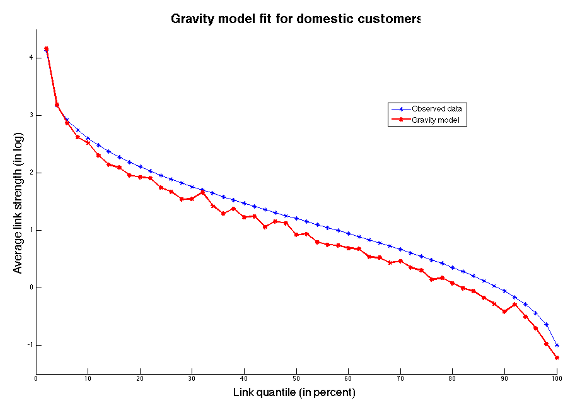 Figure 4: The gravity model provides a high-quality fit for both groups, validating the network definition.
Critical Analysis & Conclusion
This work marks a shift from studying "where we live" to "where we spend."
Key Takeaways:
- Policy Implications: Governments can use this data to identify "true" economic regions that might not match outdated 20th-century administrative lines.
- Tourism Optimization: Marketing can be tailored—promoting rural tourism to nearby Europeans while keeping major city hubs optimized for intercontinental visitors.
- Limitations: The study relies on a single bank's data (BBVA). While BBVA is massive, it may not perfectly represent the entire population's demographic nuances. Furthermore, cash transactions remain an "invisible" variable.
In conclusion, Money on the Move proves that financial data is a high-fidelity mirror of human society, reflecting our history, our geography, and our cultural preferences with startling accuracy.