
Monitoring Autoregressive Social Networks: A New Likelihood-Based Frontier
Monitoring autoregressive binary social networks based on likelihood statistics
This paper introduces a statistical framework for monitoring autoregressive binary social networks using likelihood ratio test-based methods. By utilizing a logit link function that incorporates both vertex attributes and temporal dependencies (AR(1) structure), the authors propose three control chart methods—Static, Dynamic Self-Starting, and Dynamic Window—to achieve SOTA anomaly detection in evolving network streams.
TL;DR
In the world of social network analysis, "who talks to whom" isn't just about their roles—it's about their shared history. This paper introduces a sophisticated monitoring framework that treats network edges as autoregressive binary variables. By integrating vertex attributes with temporal dependencies via a Logit link function, the researchers developed three likelihood-based control charts that can detect "scandal-level" anomalies—like those seen in the Enron bankruptcy—faster and more accurately than traditional methods.
Problem & Motivation: The "Memory" of Networks
Most statistical process control (SPC) for networks assumes that a connection today is independent of a connection yesterday. However, human relationships have "memory." If two people communicated in the previous period, they are statistically more likely to do so again.
The Problem: Ignoring this Autocorrelation leads to:
- Bias: Parameter estimates for vertex attributes (like age or job title) become skewed.
- False Alarms: Natural fluctuations in communication patterns are misinterpreted as anomalies.
The authors' insight was to move beyond the "static snapshot" view of networks and embrace a time-dependent model where the previous state of an edge directly influences its current probability.
Methodology: The Autoregressive GLM
The core of the paper lies in the Autoregressive Binary Network Model. Unlike standard Bernoulli distributions, the probability of a link between node and is calculated using:
- : Represents the similarity of vertex attributes (e.g., Job Role, Age).
- : The autoregressive component capturing the "memory" of the edge.
Three Monitoring Strategies
The authors propose three distinct ways to define the "Reference Set" (Phase I data) against which new data is tested:
- Static Reference: The baseline stays fixed. Best for detecting absolute deviations.
- Dynamic Self-Starting: The reference set grows as new in-control samples arrive.
- Dynamic Window (FIFO): Only the most recent samples are kept. This is the most adaptive to "natural evolution" in social behavior.
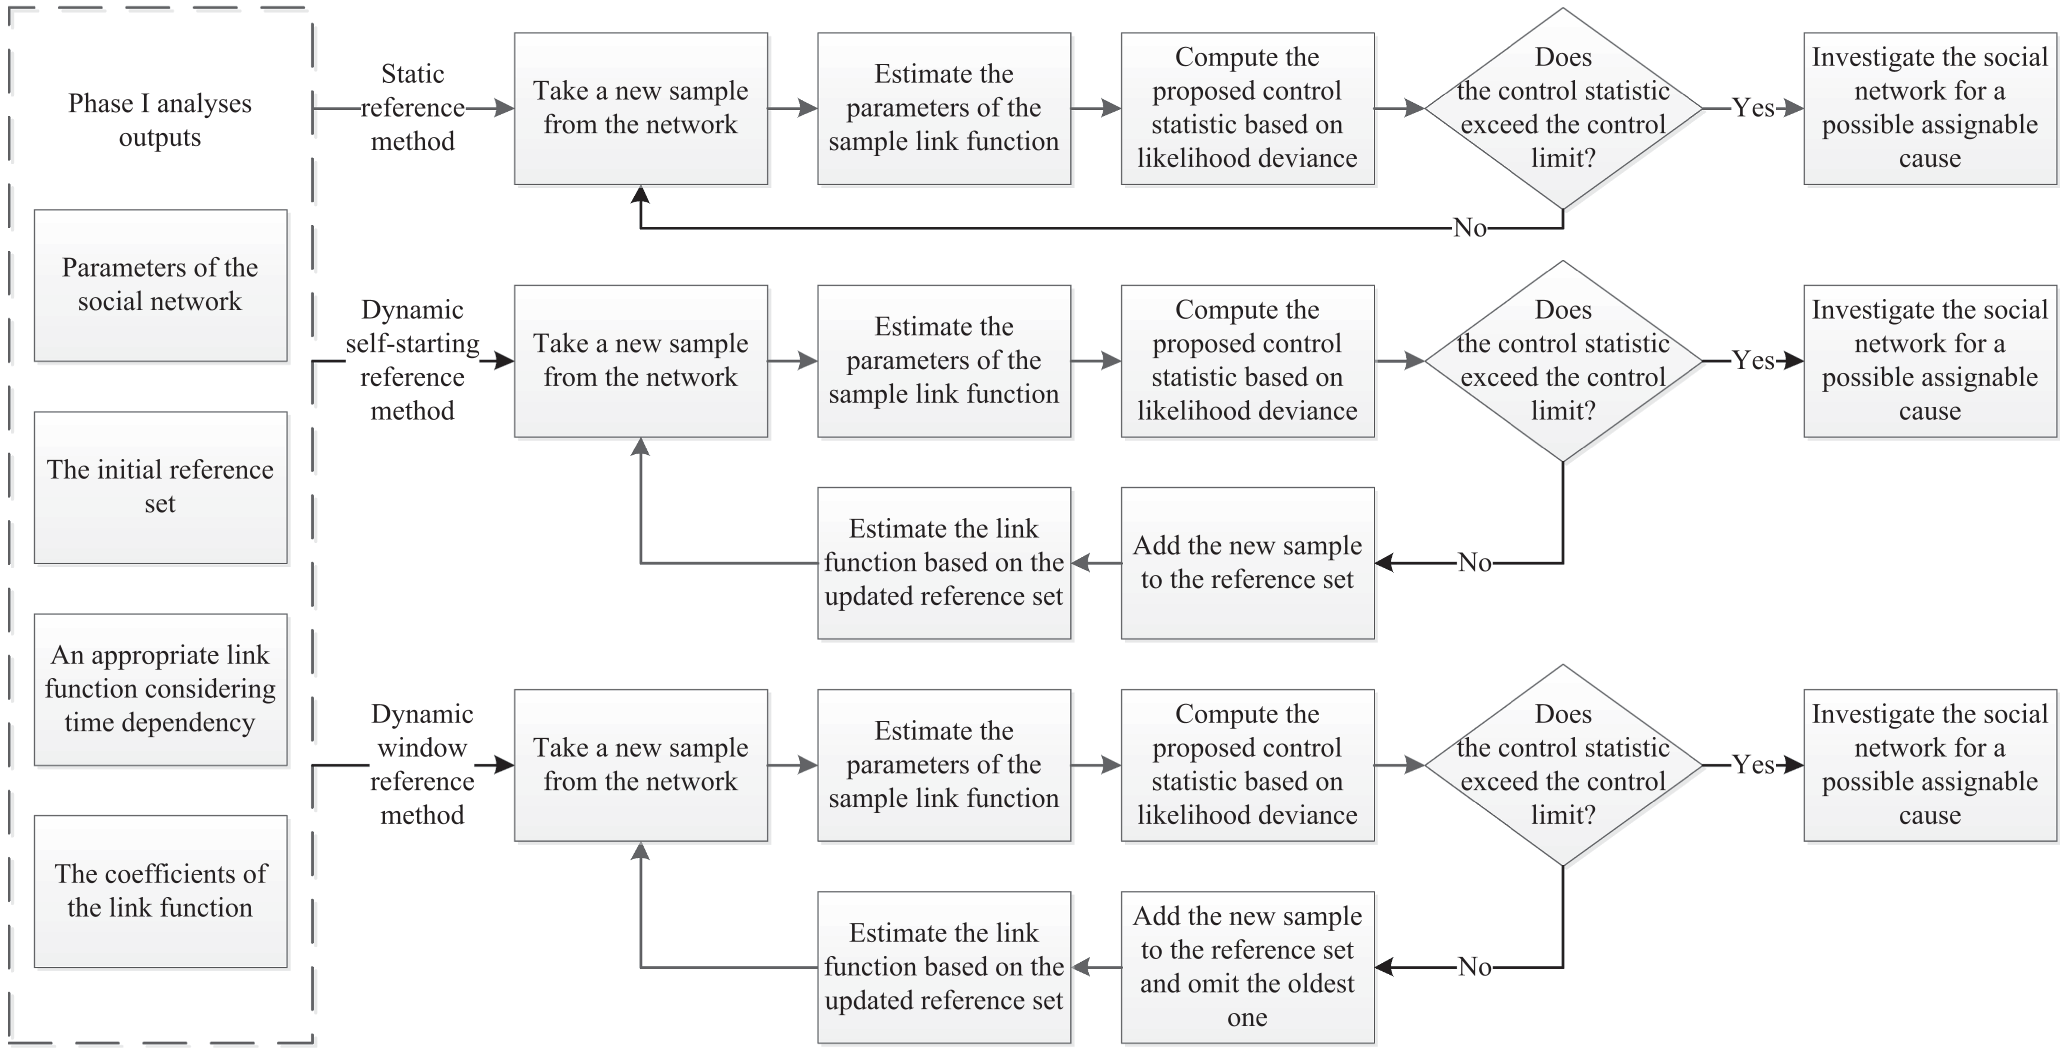 Figure 1: The overarching workflow from Phase I parameter estimation to Phase II online monitoring.
Experiments & Results
The framework was tested against the infamous Enron email dataset. The researchers focused on 47 senior employees (PR, CEO, DM) across 189 weeks.
Performance vs. SOTA
The proposed LRT statistics were compared against the Pearson residual method (Gahrooei & Paynabar, 2018).
- Sensitivity: The proposed methods detected shifts in autocorrelation () significantly faster.
- Robustness: Even with small networks (), the dynamic window method remained stable, provided the reference set was sufficiently sized.
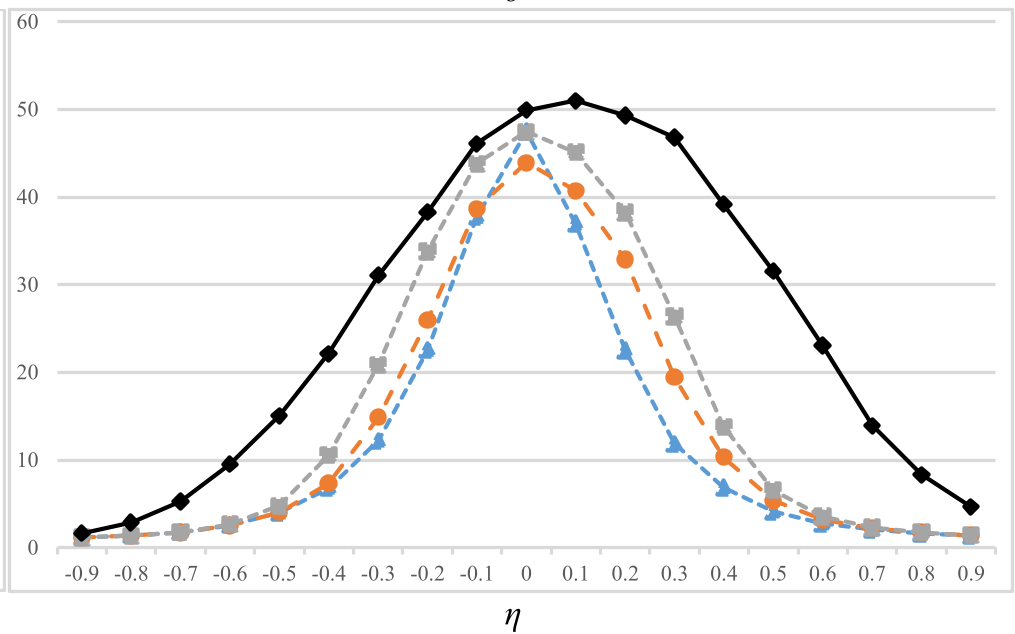 Figure 2: ARL curves showing the proposed methods' efficiency in signaling out-of-control states compared to the Pearson residual baseline.
Real-World Evidence: Enron
In the Enron case study, the charts clearly signaled at critical historical junctures, such as the period following public announcements of the company's financial scandal, where communication structures radically shifted away from the "in-control" baseline.
Critical Analysis & Conclusion
Takeaway
This work bridges the gap between Time Series Analysis and Network Science. By treating edges as AR(1) processes, it provides a much more realistic lens for corporate and security monitoring.
Limitations & Future Work
While powerful, the model assumes the number of vertices is fixed. In real-world social media, nodes appear and disappear constantly. Future research should look into:
- Spatial Autocorrelation: Where node A's behavior affects node B's behavior (not just its own history).
- Time-Varying Attributes: Adapting to shifts in roles or interests over long durations.
Final Thought
For data scientists building anomaly detection systems for communication platforms, this paper proves that likelihood statistics, when combined with a dynamic reference design, offer a robust defense against both sudden shocks and gradual drifts in network topology.