
Monitoring the Pulse of the City: Real-Time Spatial Tracking of Twitter Trends
Monitoring Spatial Coverage of Trending Topics in Twitter
The paper introduces a real-time geostreaming framework to monitor the spatial coverage and evolution of trending topics on Twitter. By utilizing a discretized grid-based approach and sliding window semantics, it identifies contiguous geographic areas where specific hashtags are popular, achieving high efficiency in tracking topic expansion and contraction.
TL;DR
Researchers have developed a high-efficiency framework to map where Twitter topics are trending in real-time. By dividing the map into a grid and using a "sliding window" to watch the latest tweets, the system can instantly identify if a discussion (like #tubestrike) is expanding across London or fading away, processing thousands of tweets in less than a second.
The Challenge: Speed vs. Geography
Social media is a geostreaming firehose. While we can easily see what is trending globally, understanding the local footprint of an event is much harder. If a fire breaks out or a protest starts, the discussion has a physical shape that grows and shrinks.
Existing tools hit two walls:
- Computational Complexity: Exact spatial clustering (grouping every coordinate point) is too slow for real-time streams.
- Data Sparsity: Only about 2% of tweets are geotagged, making it difficult to draw accurate boundaries around a "trend."
Methodology: The Triple Discretization Approach
The authors avoid expensive calculations by simplifying the world into three dimensions:
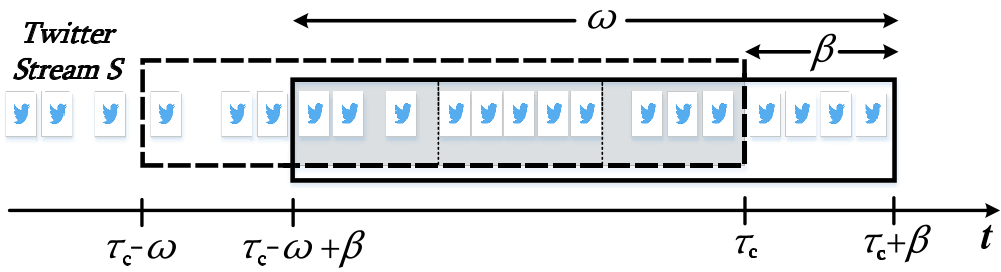
- Time: Using a Sliding Window divided into "panes." This allows the system to drop old tweets and add new ones incrementally without re-calculating everything.
- Space: A Uniform Grid. Instead of finding the exact center of a cluster, the system simply marks which "cells" on a map have enough tweets to be considered "hot."
- Text: Focuses exclusively on Hashtags. By measuring the Jaccard or Cosine similarity of hashtags, the system groups tweets into "Topics" without needing complex Natural Language Processing.
The 3-Stage Pipeline
- Topic Detection: Tweets falling into a cell are compared against existing local topics. If they match (via hashtag similarity), they join the cluster; if not, they start a new one.
- Popularity Filtering: The system filters out "noise." A topic only becomes "trending" in a cell if its tweet count exceeds a threshold (e.g., 0.2% of total window volume).
- Coverage Discovery: This is the "magic" step. The system looks for adjacent "hot" cells and merges them into a single Coverage Area, representing the true shape of the event.
Results: Efficiency at Scale
Experiments using London Twitter data proved the system's robustness. Even when the data volume was artificially inflated by 100x to simulate a massive stream, the system remained performant.
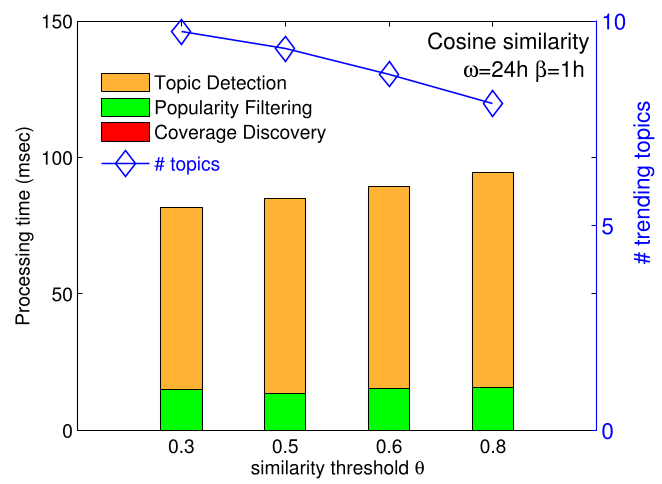
Key Insight: Grid granularity matters. A grid that is too coarse (10x10) lumps unrelated events together, while a grid too fine (100x100) fragments a single event into too many tiny pieces. The "sweet spot" for London was found to be a 50x50 grid (cells of roughly 1km²).
Case Study: #tubestrike
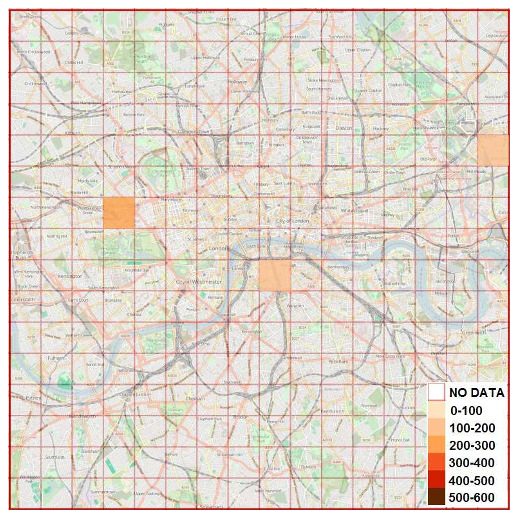
The system successfully tracked the #tubestrike event in May 2014. As shown in the visualization below, the topic didn't just exist; it moved. It started near major transit hubs (Paddington station) and expanded/contracted as the day progressed—a level of detail standard "Trending Topics" lists cannot provide.
Critical Insight & Future Outlook
The brilliance of this work lies in its Heuristic Simplicity. By treating the problem as a "grid-filling" exercise rather than a "point-clustering" exercise, the authors unlocked real-time performance on commodity hardware.
However, the Limitations are clear: the fixed grid can still suffer from "boundary effects" where a trend split between two cells might go undetected if neither cell reaches the threshold alone. Moving toward Hierarchical Grids or Quadtrees would be the logical next step to handle varying population densities (e.g., dense city centers vs. sparse suburbs).
For urban planners, emergency responders, and marketers, this allows for a "Spatial Awareness" that turns a chaotic stream of text into a living, breathing map of human activity.