
Decoding Seizures through Waveform Sharpness: A New Morphological Benchmark
Morphology-Based Automatic Seizure Detector for Intracerebral EEG Recordings
The paper introduces a novel morphology-based automatic seizure detection system for intracerebral EEG, utilizing a single characteristic feature: waveform sharpness. By decomposing EEG into half-waves (HWs) and applying a recursive median filter, the method achieves a sensitivity of 81-87% and significantly outperforms the commercial Grewal-Gotman system in specificity and the detection of non-rhythmic seizures.
TL;DR
Researchers have developed a seizure detection system for intracerebral EEG that moves away from complex spectral analysis, focusing instead on a single physical intuition: waveform sharpness. By analyzing the slope of individual half-waves and filtering for persistent "sharpness," the system achieves over 80% sensitivity and significantly reduces false positives compared to standard commercial clinical systems.
Background & Motivation: Moving Beyond Rhythmicity
The clinical review of long-term EEG recordings is a Herculean task, often involving hundreds of hours of data per patient. While many automated systems exist, they frequently stumble on non-rhythmic seizures or short-duration focal events.
Current SOTA methods often look for "rhythmic" discharges. However, many seizures are chaotic, mixed-frequency events. The authors observed that regardless of rhythm, the sharpness of the waveform—specifically the presence of Sharp Wave Complexes (SWCs)—is a universal hallmark of seizure progression. Their goal was to build a detector that mirrors how an expert human eye identifies "spiky" deviations from a smooth background.
Methodology: The Geometry of Sharpness
The core of the methodology lies in the Half-Wave (HW) Decomposition.
1. The Sharpness Feature
Instead of using Fourier Transforms, the signal is sliced into half-waves (the segment between a local minimum and maximum). For each segment, the system calculates the slope () of a best-fit straight line. This single value captures both amplitude and frequency: a steeper slope indicates higher amplitude or shorter duration—both indicators of ictal activity.
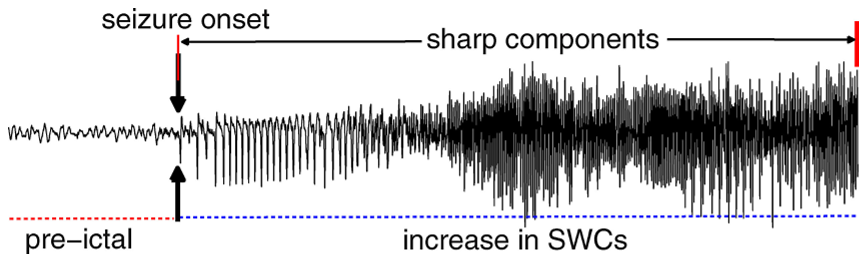 Fig 1. Evolution of sharp-wave complexes as a seizure progresses.
2. Filtering for Persistence
EEG often contains "stray" sharp spikes that aren't seizures. To solve this, the authors used:
- Activation Function: A threshold to ignore normal background waves.
- Recursive Median Filter: This is the "secret sauce." It looks for a sustained density of sharp waves over a 6-second window. A single spike won't trigger it, but a "train" of sharp waves will.
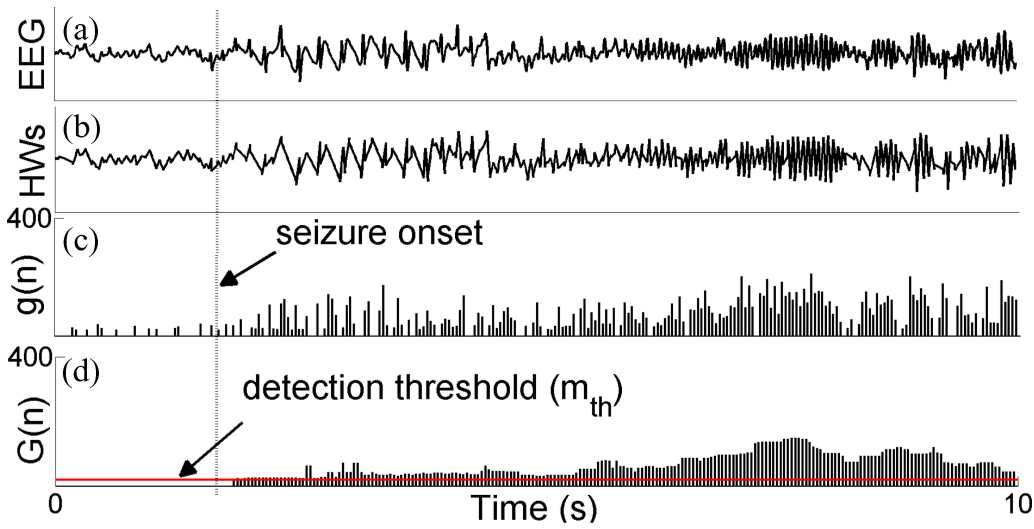 Fig 2. The pipeline: (a) Raw EEG, (b) Best-fit HW lines, (c) Sharpness values, (d) Output after the median filter.
Experiments and Comparative Results
The system was tested on two major datasets: the MNI database (Montreal) and the FSP database (Freiburg).
SOTA Comparison: Defeating the Classics
The proposed system was pitted against the Grewal–Gotman system, a staple in clinical EEG review.
- MNI Data: The proposed system achieved a much higher specificity (71.3% vs 40.5%), meaning far fewer "crying wolf" moments for clinicians.
- FSP Data: Sensitivity reached 81% compared to 65.6% for the baseline.
Catching What Experts Missed
One of the most striking findings was the system's ability to detect subclinical seizures—events that were electrographically seizures but lacked visible clinical symptoms and were thus left unmarked in the original databases. Re-evaluation by board-certified EEGers confirmed that many "false positives" were, in fact, valid seizure-like activities.
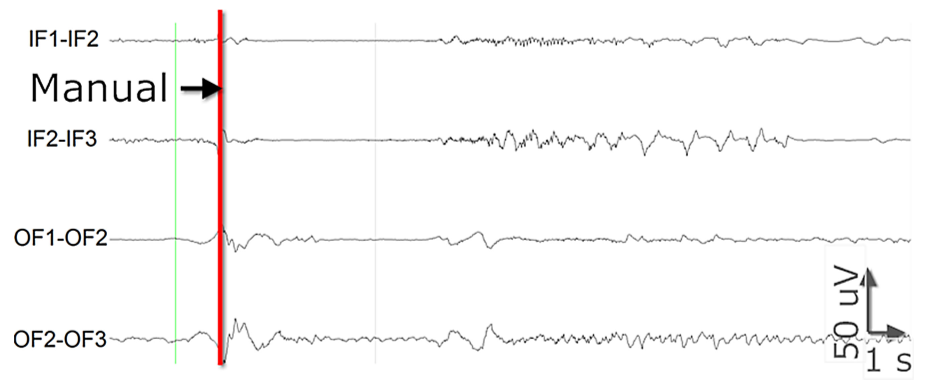 Fig 3. Examples of focal seizures correctly detected by the proposed system but missed by the commercial baseline.
Critical Insight: The Value of "False Positives"
A unique takeaway from this study is the clinical utility of the detector's "errors." The authors suggest that since the system is highly sensitive to sharp-wave activity, its detections—even if they don't overlap with a full-blown seizure—may help localize the Seizure Onset Zone (SOZ) by identifying regions with high interictal discharges (IEDs).
Conclusion & Future Outlook
This work demonstrates that geometric simplicity can often outperform spectral complexity in biological signal processing. By focusing on waveform morphology, the researchers created a tool that is computationally efficient (processing 24 hours of data in 30 minutes) and highly robust across different patients and recording sites.
Limitations: The system still struggles with high-amplitude artifacts (like electrode movement). Future iterations integrating Independent Component Analysis (ICA) for artifact removal could push the specificity even higher, potentially making it the new standard for automated epilepsy monitoring.