
Decoding the Cellular Pulse: Why Most Calls are Local (but Some Define a Nation)
Most Calls Are Local (But Some Are Regional): Dissecting Cellular Communication Patterns
This paper presents a large-scale analysis of cellular communication patterns using a nationwide CDR dataset from an African nation, encompassing over 500 million records. By applying Laplacian Eigenmaps and t-SNE, the authors identify 21 distinct "latent" regional communities, uncovering how human social interactions are predominantly local but exhibit specific regional and trans-national signatures.
TL;DR
By dissecting a massive dataset of 500 million call records, researchers from the University of Minnesota have mapped the "hidden" social geography of a nation. Using advanced manifold learning, they proved that while we primarily talk to our immediate neighbors, our communication patterns form 21 distinct regional communities that transcend simple distance, including a specific "transit" network that blankets the entire country.
Context: Beyond the Billing Record
Call Detail Records (CDRs) were originally invented for billing. However, in the era of Big Data, they have become a gold mine for understanding human behavior. Most previous studies were limited by "half-blind" data—they knew where a call started but not where it ended. This paper breaks that barrier by analyzing a nationwide dataset where both the origin and destination towers are known, allowing for a complete mapping of the nation's "communication topology."
The Problem: The Failure of Linear Thinking
Why is this hard? If you simply look at a map, you might assume people talk to those closest to them. While "locality" is a strong force, the data is incredibly messy and "skewed"—urban towers are packed together while rural towers are sparse.
The authors point out that traditional linear tools like Principal Component Analysis (PCA) are "ill-suited" for this task. The data's complexity is non-linear; communication doesn't just fade away with distance in a straight line. Instead, it forms clusters based on social ties, economic activities, and transit routes.
Methodology: Finding the Latent Manifold
To find order in the 500 million records, the researchers treated each tower as a point in a high-dimensional space.
- The OD Matrix: They built a massive Origin-Destination matrix. If Tower A calls Tower B, that’s a data point.
- Manifold Learning: They used Laplacian Eigenmaps. This technique assumes that high-dimensional data actually lives on a simpler, curved surface (a manifold). It looks for "similarity" in call distributions rather than just raw volume.
- Visualization: Using t-SNE, they squashed these complex relationships into a 2D map to see which towers "behaved" like each other.
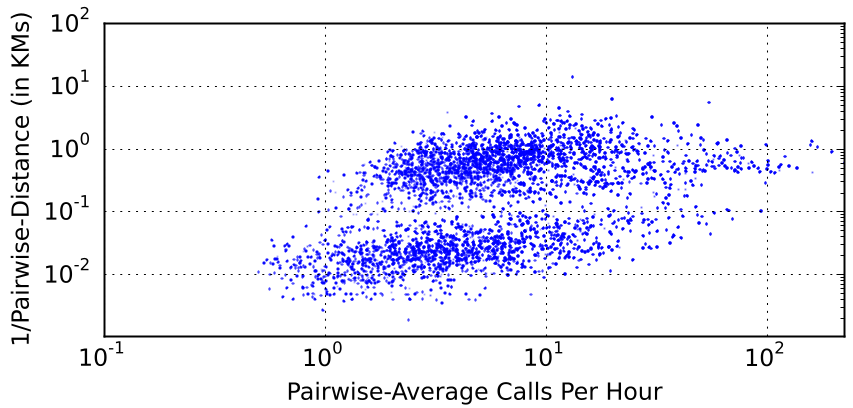 Table 1: The structure of the Origin-Destination matrix used to capture tower-to-tower interaction distributions.
Key Insights: Local, Regional, and the "Transit" Cluster
The results are a fascinating look at how a society breathes through its phones:
- The 25% Rule: The capital city generates over a quarter of all national traffic, yet its internal communication is not a monolith. It is split into five distinct "zones," including isolated communities on nearby islands.
- Distance vs. Connection: The study found that "locality effects" are diverse. Some towers have tight-knit circles (SELF calls), while others are outward-looking.
- The "Red" National Cluster: Perhaps the most striking finding was a specific cluster of towers (colored red in the study) that didn't stay in one region. These towers were spread across the nation, specifically along major transportation networks. This cluster represents the "pulse" of people in transit—travelers and truckers moving between cities.
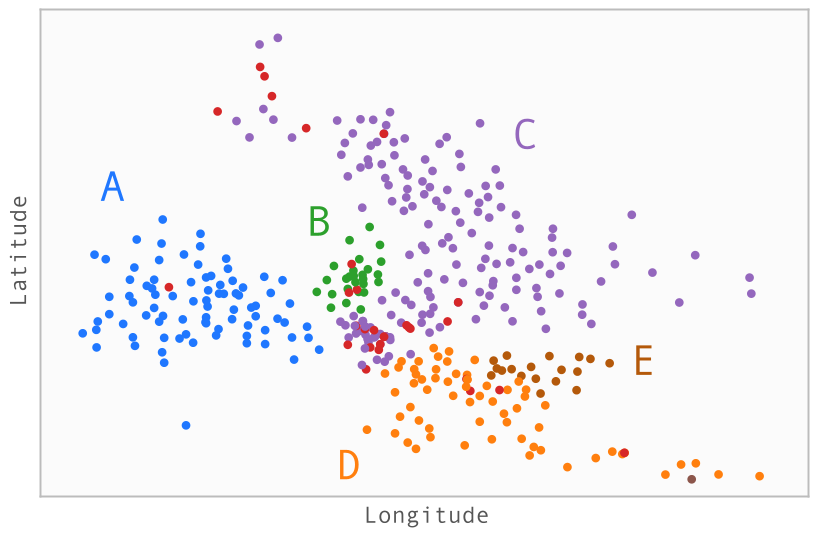 Figure 7: (a) The 21 identified clusters mapped geographically. Notice the distinct regional boundaries and the sparse 'Red' cluster spanning the nation.
Critical Analysis & Future Outlook
This work successfully demonstrates that communication geography does not equal physical geography. By using purely behavioral data (who calls whom), the model reconstructed the physical and social layout of the country without being "told" where the towers were located.
Limitations: The study relies on 2016-era cellular data (voice/SMS). In a modern context, data-heavy apps (WhatsApp, Signal) might shift these patterns. Furthermore, while the clusters are statistically sound, the "why" behind some regional boundaries requires deeper sociopolitical context.
The Takeaway: For network engineers and urban planners, the message is clear: manage resources based on interaction zones, not just population density. The next step for this research is to apply this "OD Matrix" logic to other fields, such as financial transactions or migration patterns, to map the hidden structures of our interconnected world.
Conclusion
"Most calls are local" might seem like a simple statement, but as Narayanan et al. show, the exceptions—the regional and national patterns—are what truly define the operational footprint of a cellular network and the social fabric of a nation.