
Intelligent Power Marketing: Bridging Big Data and Visualization via Entropy-Driven Analysis
Multi-Dimensional Power Marketing Linkage Analysis and Intelligent Monitoring Based on Visualization Technology
The paper introduces a multi-dimensional power marketing and monitoring framework that integrates Information Entropy Decision Trees and Clustering Algorithms. It aims to transform complex, high-dimensional electricity data into intuitive visual representations to enhance real-time monitoring of user behavior and market trends.
TL;DR
With the rise of smart grids, power companies are swimming in data but starving for insights. This paper presents a robust solution combining Information Entropy Decision Trees and Clustering Algorithms to visualize high-dimensional electricity data. By categorizing users and monitoring real-time voltage/consumption trends, the system enables "linkage marketing"—a strategy that synchronizes power supply and marketing efforts based on data-driven intelligence.
Problem & Motivation: The "Big Data" Blind Spot in Energy
Modern power companies face a paradox: they possess massive amounts of real-time data from sensor nodes, but this data is often too complex and "messy" to be useful for immediate decision-making. Traditional monitoring lacks:
- Real-time Interactivity: Difficulty in responding to sudden shifts in load or user behavior.
- Readability: High-dimensional data (influenced by economics, weather, and social factors) is hard to interpret in raw form.
- Actionable Insights: Prior works often failed to link raw consumption numbers to specific marketing tiers.
The author's insight is that by reducing the uncertainty (Entropy) of the data and clustering users based on behavioral signatures, power companies can transform an abstract grid into a manageable marketing map.
Methodology: The Core Engine
The framework operates on two primary algorithmic pillars:
1. Information Entropy Decision Trees
The system uses Information Gain to identify which attributes (e.g., social importance, credit, consumption level) are the most "telling" for classifying a user.
- Root Node Selection: Attributes with the highest information gain form the top of the tree.
- User Stratification: Users are branched into Types A, B, and C, allowing for targeted service and pricing strategies.
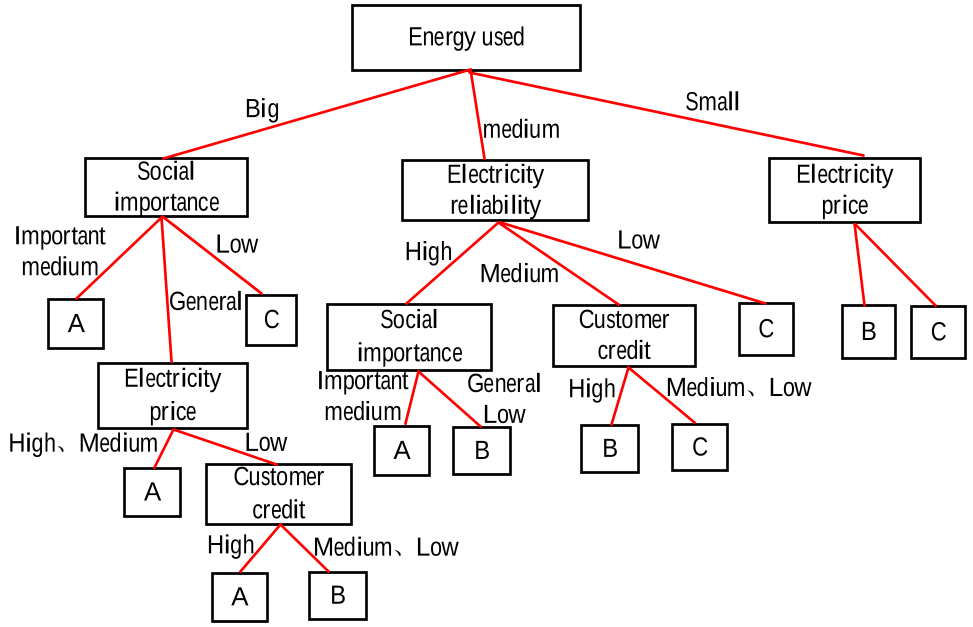 Figure 1: The hierarchical classification model for segmenting power consumers.
2. Time-Series Clustering
Since power consumption is a time-sensitive variable, the author employs a Moving Average (MA) technique to remove random noise. After standard normalization, Euclidean Distance is used to group users with similar purchasing profiles.
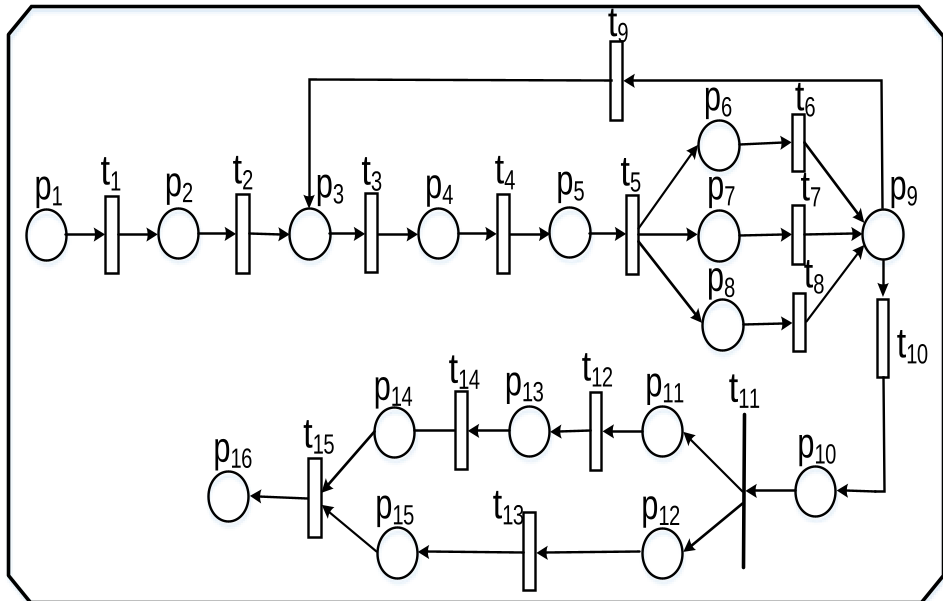 Figure 2: The distribution model of data collection nodes across the grid.
Experiments & Results: Clearer Sight, Better Sales
The study analyzed a database of hundreds of users, focusing on the correlation between input/output voltage and actual purchasing behavior.
Performance Highlights:
- Temporal Voltage Analysis: The system accurately tracked that input side voltage peaks between 08:00-12:00 (above 440V), while output side voltage peaks between 12:00-14:00 (above 224V).
- Superior Clustering: Compared to traditional K-means or basic clustering, the visualization-based approach provided much cleaner separation of user tiers.
- Market Share Identification: The model revealed that the primary power company captured 40% of the total transaction volume of the analyzed users, identifying a clear opportunity for loyalty-based marketing.
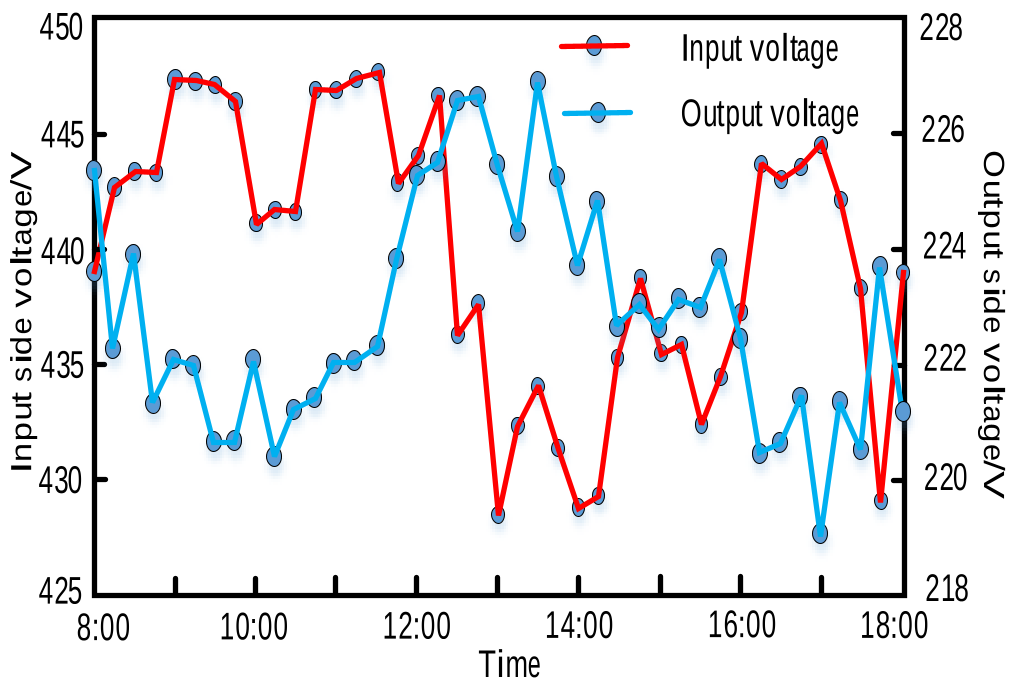 Figure 3: Real-time monitoring of input side voltage used to predict industrial and residential demand shifts.
Critical Analysis & Conclusion
Takeaway
The integration of Visualization Technology transforms the power grid from a "black box" into a transparent landscape. By using entropy to handle uncertainty and clustering to handle diversity, power companies can now implement Linkage Marketing—aligning their sales targets with the actual live performance of the grid.
Limitations & Future Work
While effective, the paper relies on Euclidean distance for clustering, which might struggle with non-linear relationships in more complex urban grids. Future iterations might benefit from Manifold Learning or Autoencoders to further automate the feature extraction process for even higher dimensional datasets.
Furthermore, the "reliability factor" () in the reconstruction function is currently a constant; making this parameter adaptive based on grid health could further improve monitoring robustness.