
Beyond Single Metrics: Multi-Objective Optimization for Key Player Identification
Multi-objective optimization to identify key players in large social networks
The paper introduces a multi-objective optimization framework to identify "key players" in social networks by balancing various centrality measures (e.g., Degree, Betweenness, Eigenvector). Utilizing the NSGA-II genetic algorithm and a novel Degree centrality-based sampling method, the approach identifies sets of influential nodes that outperform traditional single-objective metrics in tasks like eventual influence limitation (EIL) and disease immunization.
TL;DR
In the world of social network analysis, we often ask: "Who are the most important people?" Most algorithms give a single answer based on one rule—like who has the most friends or who sits between groups. This paper argues that "importance" is a multi-objective trade-off. By using Genetic Algorithms (NSGA-II) and a smart sampling technique, the authors demonstrate how to find diverse sets of key players that collectively stop gossip or prevent disease spread more effectively than any single-metric winner.
The Problem with Being "The Best" at Just One Thing
Most network scientists use node centrality to find key players. However, optimizing for a single metric often fails in practice:
- Eigenvector Centrality often picks nodes that are all huddled together in the same community (the "echo chamber" effect).
- Influence Overlap: Picking the top 5 individuals based on degree often results in nodes that share many of the same neighbors, wasting your "influence budget."
The authors observe that in real life—whether in politics, marketing, or epidemiology—we need a team that is collectively powerful.
Methodology: The Power of the "Super Node" and Pareto Fronts
The core innovation lies in shifting from "What is the best node?" to "What is the best subset?"
1. The Super Node Intuition
To evaluate a group , the authors collapse all nodes in into a single Super Node (). Any edge connected to any member of the group now connects to the Super Node. This allows us to measure the group's "collective centrality" as if they were a single administrative entity.
2. Multi-Objective Optimization (MOO)
Instead of just maximizing Degree, the algorithm looks for the Pareto Front—the set of solutions where you cannot improve one objective (like reach) without hurting another (like spatial distance between players).
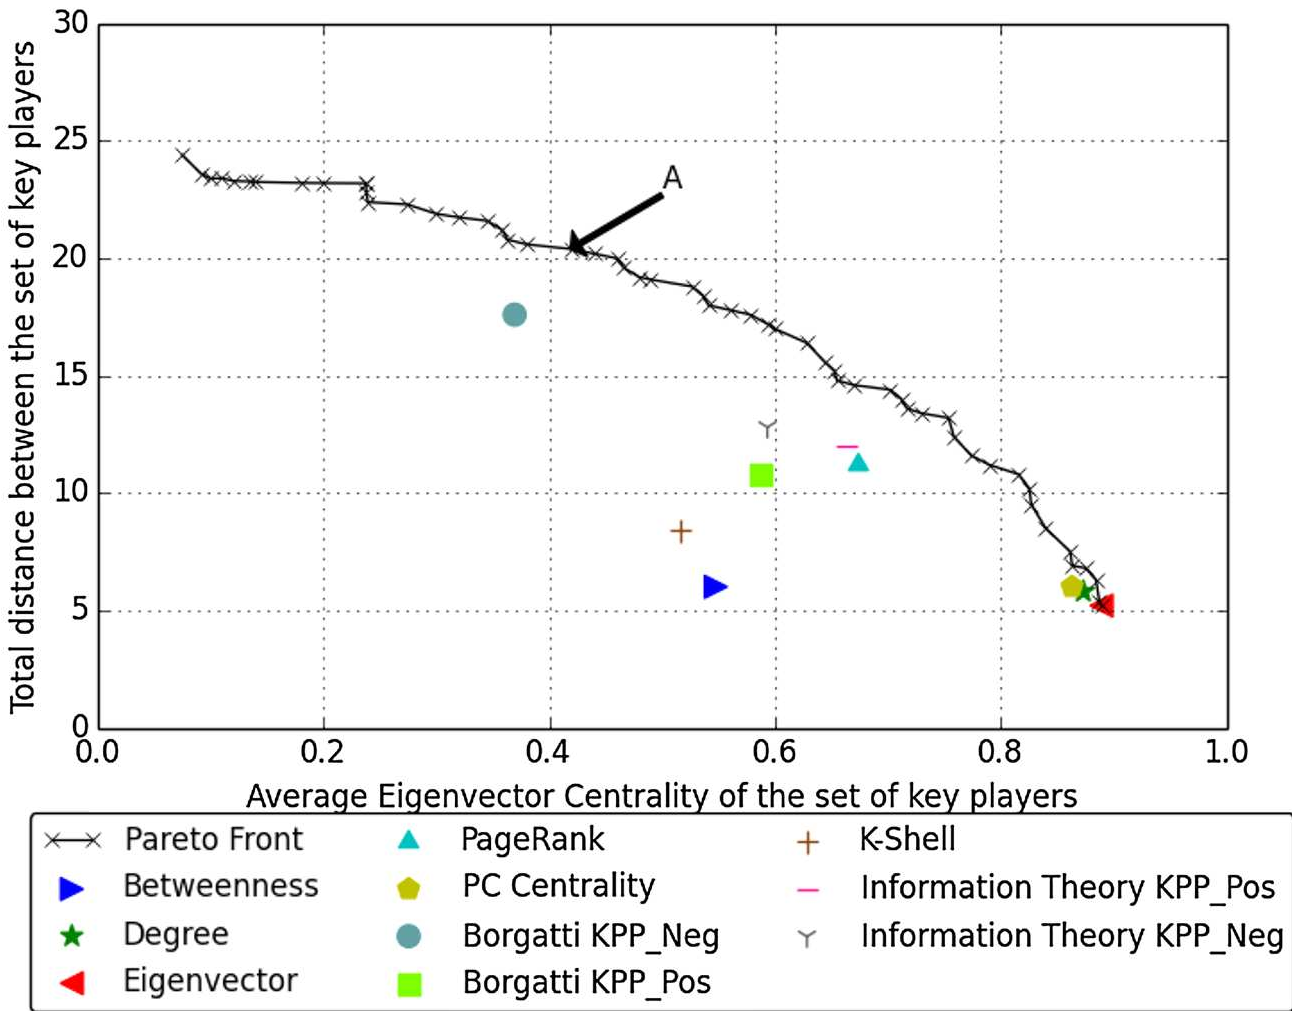 The Pareto fronts above show the trade-off between Eigenvector Centrality and Distance. Single-objective methods (the named dots) fall behind the optimized Pareto boundary.
3. Scaling to Large Graphs: Degree-Based Sampling
Computing these sets on millions of nodes is slow. The authors propose a "Degree Centrality Based Sampling" strategy. By only keeping the top of nodes by degree and their induced edges, they found that they could still catch nearly 100% of the important players for other metrics (like Closeness or Betweenness) while slashing runtime by over 60%.
Experiments: Stopping the Spread
The authors tested their "Multi-Objective" (MO) sets against the "Best-of" single metrics in two critical scenarios:
- Eventual Influence Limitation (EIL): Using "good" information to stop a "bad" gossip campaign.
- Immunization: Selecting nodes to vaccinate to stop a SIR-modeled disease spread.
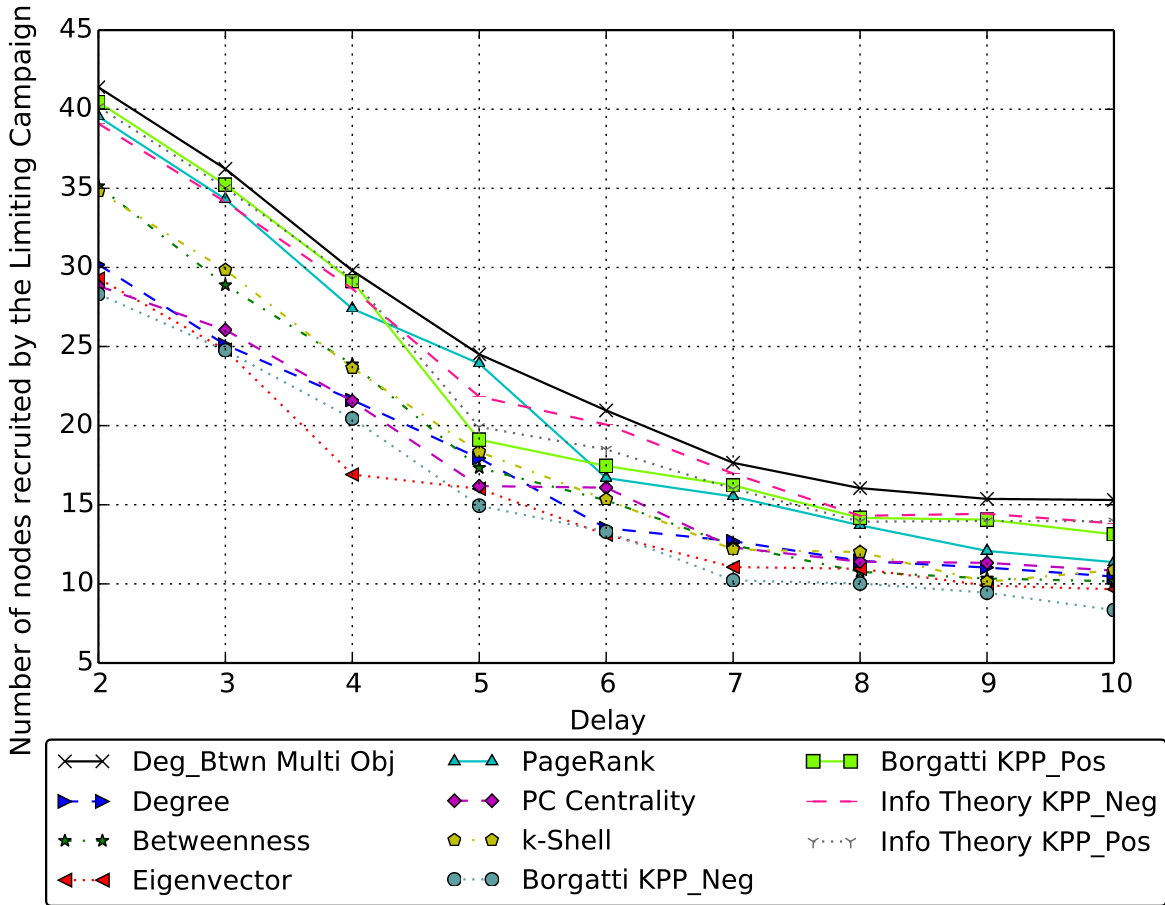 In both Dolphin and Prisoner networks, the Multi-Objective approach (achieving high reach and high dispersion) recruited more nodes to the "limiting campaign" than traditional benchmarks.
Critical Insight & Conclusion
The study proves that group synergy matters more than individual ranking. A team of players who are "pretty good" at several things and strategically spread out across the network is more resilient than a team of "all-stars" who all occupy the same niche.
Key Takeaways:
- Heuristic Efficiency: Degree-based sampling is an surprisingly robust way to prune a graph before running heavy optimization.
- Collective Behavior: Always model a target set as a single unit (Super Node) to detect redundancies.
- Pareto as a Benchmark: Even if you only use one metric, plotting your results against a Pareto front reveals exactly how much "efficiency" you are leaving on the table.
Limitations: The study focuses on static networks. In modern social media, the graph topology changes hourly. Applying MOO to time-series data remains the next frontier.