
Multi-Resolution Spatio-temporal Mining: Beyond Simple Averages in Air Quality Regionalization
Multi-Resolution Spatio-temporal Data Mining for the Study of Air Pollutant Regionalizationl
This paper introduces a multi-resolution spatio-temporal data mining framework that combines Wavelet Transforms (WT) and Augmented Self-Organizing Maps (AugSOM) to achieve regionalization of air pollutant data. By integrating Discrete and Continuous Wavelet Transforms (DWT/CWT), the study successfully decomposes non-stationary PM10 concentration time series into multiple scales for more robust spatial clustering across 71 monitoring stations.
TL;DR
Air quality management often relies on static administrative regions, yet pollution is a dynamic, multi-scale phenomenon. This paper proposes a sophisticated pipeline using Wavelet Transforms (WT) and Augmented Self-Organizing Maps (AugSOM) to cluster air monitoring stations. By analyzing data across multiple temporal resolutions, the authors identify natural "pollution regions" that more accurately reflect industrial and geographical realities than standard government classifications.
The Scale Dilemma
In spatio-temporal data mining, the choice of temporal scale acts as a filter. If you analyze air pollutants (like PM10) on a daily scale, the results are often cluttered by local noise and transient events. Conversely, an annual scale smooths out everything, making distinct industrial zones look identical to residential ones.
The authors argue that the "truth" exists across all scales simultaneously. Prior work failed because it chose a single scale arbitrarily. This study utilizes the non-stationary analysis capabilities of Wavelets to ensure that both local spikes and long-term trends inform the clustering process.
Methodology: Wavelets Meet Neural Topographies
The framework consists of three critical stages:
1. The Wavelet Lens (CWT & DWT)
Instead of passing raw time series to the model, the authors use Continuous Wavelet Transform (CWT) and Discrete Wavelet Transform (DWT).
- CWT provides a detailed "scalogram" (time-frequency representation), capturing fine-grained variations.
- DWT decomposes signals into dyadic scales (2, 4, 8 days, etc.), providing a compressed yet multi-resolution view.
2. Augmented SOM (AugSOM)
Standard SOMs are great for visualization but lack a formal mechanism to "cut" the map into discrete clusters. The Augmented SOM introduces a second Kohonen layer. The weights of the first layer serve as inputs to the second, allowing the network to self-organize the clusters themselves.
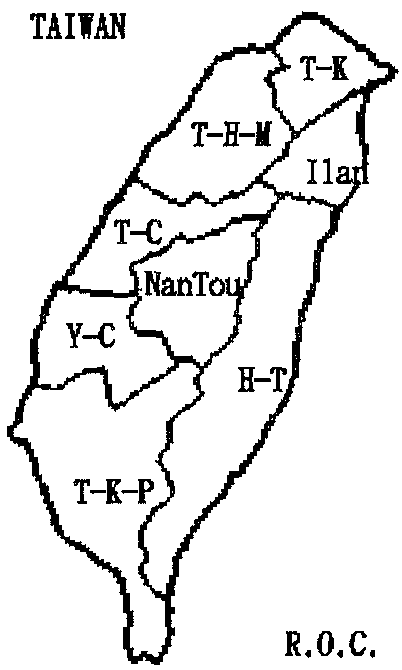 Figure 1: The distribution of monitoring areas used as the spatial input for the study.
Experimental Insights
The study analyzed PM10 data from 71 stations in Taiwan. A key technical challenge was missing data (approx. 10%), which they addressed using an inverse-distance weighting method before the transformation stage.
Performance Metrics
The authors used Cohesion (P) and Variance (V) to evaluate the clusters.
- Finding: CWT-based clustering revealed nuances that DWT missed. For instance, CWT identified that the Tainan-Kaohsiung-Pingtung area—usually treated as one block—actually contains distinct environmental zones due to the heavy industrial nature of Kaohsiung vs. the commercial nature of Tainan.
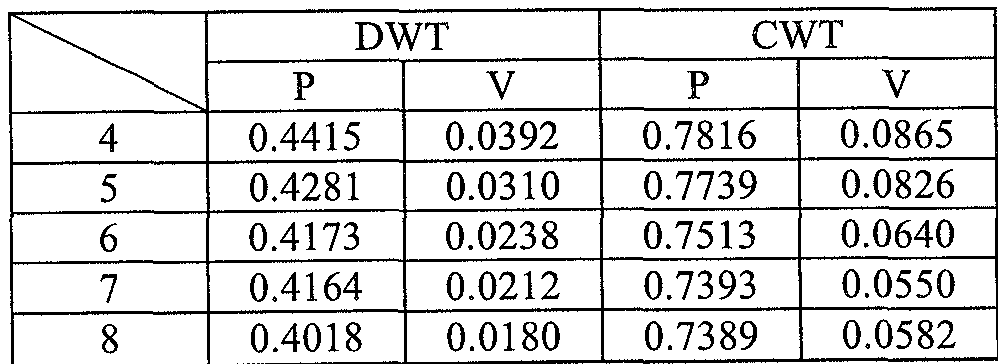 Table 1: Quantitative results showing that as the number of clusters increases, cohesion and variance decrease, with DWT providing more compact clusters at dyadic scales.
Visualizing Regionalization
The maps generated by the AugSOM (Figures 3-6 in the paper) illustrate how different pollutant "regimes" operate. One striking discovery was how high-altitude stations (like Yangmin Mountain) were clustered with remote eastern coastal stations, despite being hundreds of kilometers apart, because their "wavelet signatures" of cleanliness were nearly identical.
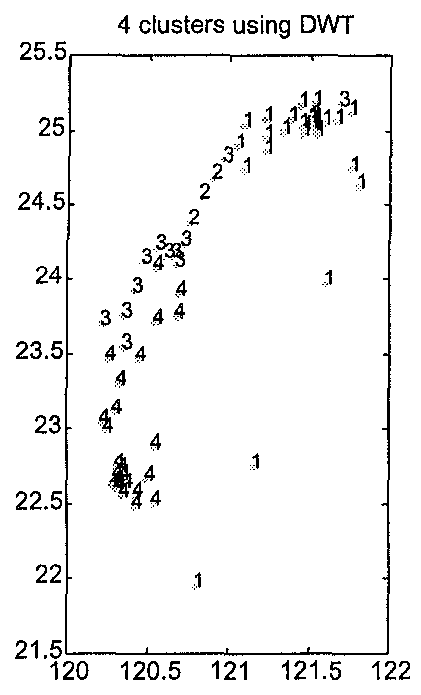 Figure 2: Spatial regionalization results showing the emergence of homogeneous pollution zones across Taiwan.
Critical Analysis & Future Directions
Takeaway: This research proves that "Regionalization" should be a data-driven process. By using Multi-resolution analysis, we can reduce the "local noise" of small scales while avoiding the "over-smoothing" of large scales.
Limitations:
- Hard Clustering: The current SOM approach assigns a station to exactly one cluster. However, geography is rarely discrete; "Spatial Transition Zones" likely exist where a station shares characteristics of two regions.
- Scalability: The computational cost of CWT on massive datasets (e.g., thousands of sensors) could be a bottleneck.
The Future: The authors suggest moving toward Fuzzy SOM or Rotated Principal Component Analysis (RPCA) to support "soft clustering," allowing for a more nuanced representation of how pollution boundaries shift over time.