
MWGSP: Beyond Topology—Advancing Social Network Analysis through Multicriteria Weighted Graph Similarity
An Application of Multicriteria Weighted Graph Similarity Method to Social Networks Analyzing
The paper introduces the Multicriteria Weighted Graph Similarity Problem (MWGSP) method, a framework designed to compare weighted graphs by integrating structural topology and quantitative attributes of nodes and arcs. Applied to social network analysis, notably the 9/11 terrorist network and corporate email flows, it achieves a multidimensional assessment of network evolution and anomaly detection.
TL;DR
Determining how "similar" two social networks are involves more than just looking at who talks to whom; it requires understanding the intensity and nature of those connections. This paper presents the MWGSP (Multicriteria Weighted Graph Similarity Problem) method, combining structural topology with quantitative node/arc attributes to detect anomalies in terrorist cells and corporate communications.
Background: The Limits of Binary Graphs
In classic Graph Theory, an edge is often binary—it either exists or it doesn't. However, in a social network, a "connection" has weight: How many emails were sent? How much money was transferred? Previous SOTA methods like Graph Edit Distance (GED) are computationally expensive (NP-hard), making them impractical for real-time monitoring. The authors argue that we need a faster, multicriteria approach that treats graph similarity as a decision-making problem.
Methodology: The Best of Both Worlds
The core of the MWGSP method lies in its ability to split similarity into two distinct dimensions:
1. Structural Similarity ()
The authors utilize a convergence-based approach to find a similarity score between nodes and arcs. By iteratively updating a transition matrix using the Frobenius norm, the method identifies nodes that play similar roles in the network architecture, even if they don't share identical neighbors.
2. Quantitative Similarity ()
This is where the "Weighted" part of the graph shines. By applying p-norm distances to specific attributes (e.g., frequency of contact, importance of a node), the method calculates how similar the behavior of the entities is, regardless of the structure.
3. The Multicriteria Optimization
Finally, these scores are aggregated into a single scalar function : The goal is to find the graph that maximizes this function against a "pattern" graph .
 The mathematical definition of a Weighted Graph (WG) used to encapsulate both structural and quantitative data.
Experiments: Tracking the 9/11 Cell
One of the most compelling applications in this paper is the analysis of the terrorist network involved in the September 11 attacks.
The authors compared the network structure at two different intervals:
- Long before the attack: Representing "stable" or preparation-phase communication.
- Short time before the attack: Representing the execution phase.
Result: The structural similarity dropped significantly (from ~1.0 to 0.88). This delta serves as a "Threat Trigger." By setting a threshold, security agencies could theoretically automate the detection of a cell moving from "planning" to "active" status.
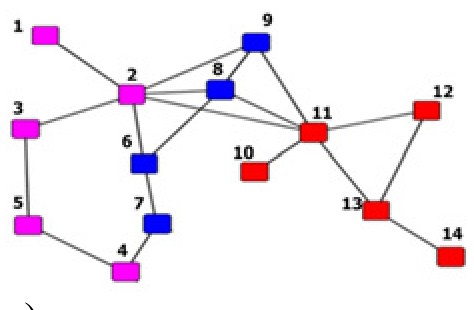 Figure 1: Visualization of the 9/11 terrorist network structure used for the MWGSP validation.
Business Logic: Email Anomaly Detection
The paper also applies MWGSP to corporate email networks. By establishing a "Normal Week" baseline, the method evaluates subsequent weeks. As shown in the results table below, the "1st Week" showed the lowest value (0.144), flagging it as the most anomalous period in terms of communication volume and structural hierarchy.
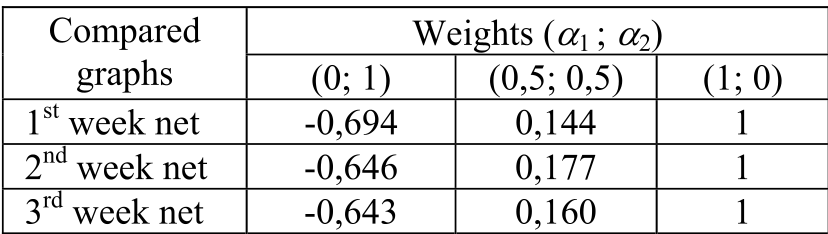 Table 1: Scalar function values H(G) comparing different weeks of email traffic. Lower values indicate higher deviation from 'Normal' behavior.
Critical Insight & Conclusion
The true value of this work is the shift from graph matching as a "search problem" to graph matching as a multicriteria decision problem. By allowing researchers to weight structural versus quantitative data (), the model can be tuned for different domains—higher weight on structure for terrorist cells, higher weight on volume for financial fraud.
Limitations: The model is highly dependent on Domain Knowledge to set the weights () and the thresholds. Future research could focus on using machine learning to automatically learn these weights from historical labeled data.
Future Work: Integrating this with real-time stream processing could allow for live "hot-spot" detection in social and computer networks.