
Twitter Social Stream: Navigating the Buzz with Multi-level Exploration
Multilevel exploration in Twitter social stream
This paper presents a methodology and architectural framework for multi-level exploration of Twitter streams, combining semantic, sentiment, and sociodemographic parameters. It introduces two primary exploration modes—discovery of unknown emerging events (buzz finding) and comparative trend analysis—implemented via a scalable SaaS architecture.
TL;DR
Researchers from the University of Lille have developed a high-performance system to decode the "chaos" of Twitter. By leveraging a scalable architecture and a unique Comparative Strategy, they transform millions of noisy tweets into actionable insights for politics, fashion, and emergency events, reaching temporal resolutions that traditional surveys cannot match.
Problem & Motivation: The Noise vs. Signal Dilemma
In the digital age, social networks like Twitter act as a "mirror of society." However, using this mirror for scientific or commercial diagnosis faces two major hurdles:
- Low Precision: Individual tweets are short, informal, and filled with sarcasm or spam. Many sentiment analysis tools hit a "glass ceiling" of ~50% accuracy.
- Static Constraints: Traditional face-to-face surveys are too slow. By the time a report on a fashion trend or a political shift is published, the "Twitosphere" has already moved on.
The authors' insight is simple yet profound: Don't ignore the noise—cancel it out. By comparing two or more subjects (e.g., two smartphone brands or two political candidates), the inherent errors of Twitter (spam, bots, linguistic ambiguity) affect both sides equally, allowing the true delta in public opinion to emerge.
Methodology: Zooming into the Social Stream
The system operates on two distinct levels:
1. The Buzz Finder (Discovery Mode)
This mode is for "unknown unknowns." By using a multi-scale timeline (ranging from 15 minutes to 72 hours), users can identify sudden spikes in keywords.
- Case Study: The death of the artist Prince. The system detected a massive surge in mentions by men nearly two years before the news hit traditional mainstream saturation in certain regions, providing a clear chronological breakdown of how the "buzz" formed.
2. Comparative Analysis (Survey Mode)
Modeled after "Googlefight," this allows users to compare groups of keywords. The architecture uses ElasticSearch for its superior insertion speed (2x faster than MySQL), enabling near real-time processing of millions of documents.
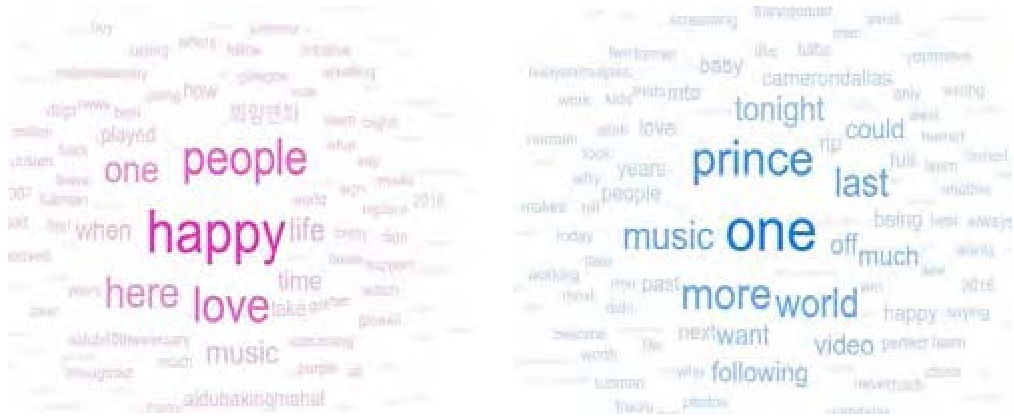 Fig 1: The architecture allows for dynamic tokenization and multi-parameter filtering (gender, language, time).
Experiments & Results: Real-World Testing
The authors put their "Comparative Strategy" to the test in two volatile domains:
Fashion Trends (Color Preferences)
By analyzing tweets containing colors + "pants," they found that while "Blue" is the most discussed, "Pink" often holds higher positive sentiment (~85%). Crucially, they identified sociodemographic divides—such as yellow pants having a 73% approval rate among men but only 49% among women—insights that help brands target design more effectively.
The 2016 US Election
Processing over 30 million tweets, the system compared candidates across English and French-speaking communities.
- Key Finding: French speakers held significantly more "Neutral" views (~40%) compared to English speakers, reflecting their status as outside observers.
- Efficiency: The entire 30-million-tweet analysis was processed in just 1 minute and 50 seconds on a 5-node cluster.
 Table 1: Comparative perception of 2016 candidates across linguistic communities.
Critical Analysis & Conclusion
The true value of this work lies in its pragmatism. While many researchers focus on building complex NLP models to understand a single tweet, this work focuses on statistical representativity.
Limitations: Despite the comparative advantage, "black swan" events like coordinated bot manipulation or extreme linguistic shifts (new slang) still pose a threat to data integrity. Furthermore, Twitter's API limitations (accessing only a slice of the total stream) mean the data is always a sample, not a total census.
Takeaway: For future researchers and product managers, the message is clear: when dealing with big, noisy data, the delta (the difference between items) is often more accurate and useful than the absolute value of the items themselves.