
CNN for Music Emotion: Bridging the Gap Between Audio Spectrograms and Human Affect
Predicting Music Emotion by Using Convolutional Neural Network
This paper proposes a Convolutional Neural Network (CNN) based framework for predicting music emotion in the continuous Valence-Arousal (V-A) dimensional space. By transforming audio signals into Constant-Q Transform (CQT) spectrograms, the method achieves a Top-3 accuracy of 82.24% for valence and 81.80% for arousal on the EmoMusic dataset.
TL;DR
Researchers have developed a more intuitive way to teach machines to "feel" music. By treating audio signal processing as a visual recognition task—transforming music into Constant-Q Transform (CQT) spectrograms—and applying a Convolutional Neural Network (CNN), this study achieves over 82% Top-3 accuracy in predicting emotional intensities. Unlike previous methods, it thrives on a granular 21-category classification scale in the Valence-Arousal space.
Background & Motivation: Beyond Discrete Labels
Music emotion is notoriously subjective. While traditional models use discrete tags like "Anger" or "Joy," these are often too coarse. The authors of this paper adopt the Thayer Dimensional Model, which maps emotion onto a 2D coordinate system:
- Valence: From negative (sad/angry) to positive (happy/serene).
- Arousal: From low (calm/bored) to high (excited/tense).
The core challenge lies in the "Semantic Gap"—how do we translate raw, sequential audio signals into these high-level psychological constructs without losing the context of the human auditory experience?
Methodology: The Power of Constant-Q Transform (CQT)
Most audio processing uses the Short-Time Fourier Transform (STFT), but STFT uses a linear frequency scale. Humans, however, perceive pitch logarithmically.
1. Feature Extraction
The authors chose the Constant-Q Transform (CQT). Unlike STFT, CQT provides:
- Higher spectral resolution at low frequencies.
- Higher temporal resolution at high frequencies.
- A representation that mirrors the human auditory system’s log-frequency perception.
2. Preserving Continuity
Emotion isn't instantaneous; it builds over time. The researchers discovered that a 5-second sliding window with 50% overlap was the "sweet spot" for capturing musical continuity. Shorter windows (0.5s) provided insufficient context, while longer windows (10s) diluted the emotional specificity.
3. CNN Architecture
The spectrograms (64x64x3) were fed into a CNN with two blocks of interleaved Convolutional layers (3x3 filters), Max-Pooling, and Dropout, followed by Dense layers to output a probability distribution across 21 quantized emotion levels.
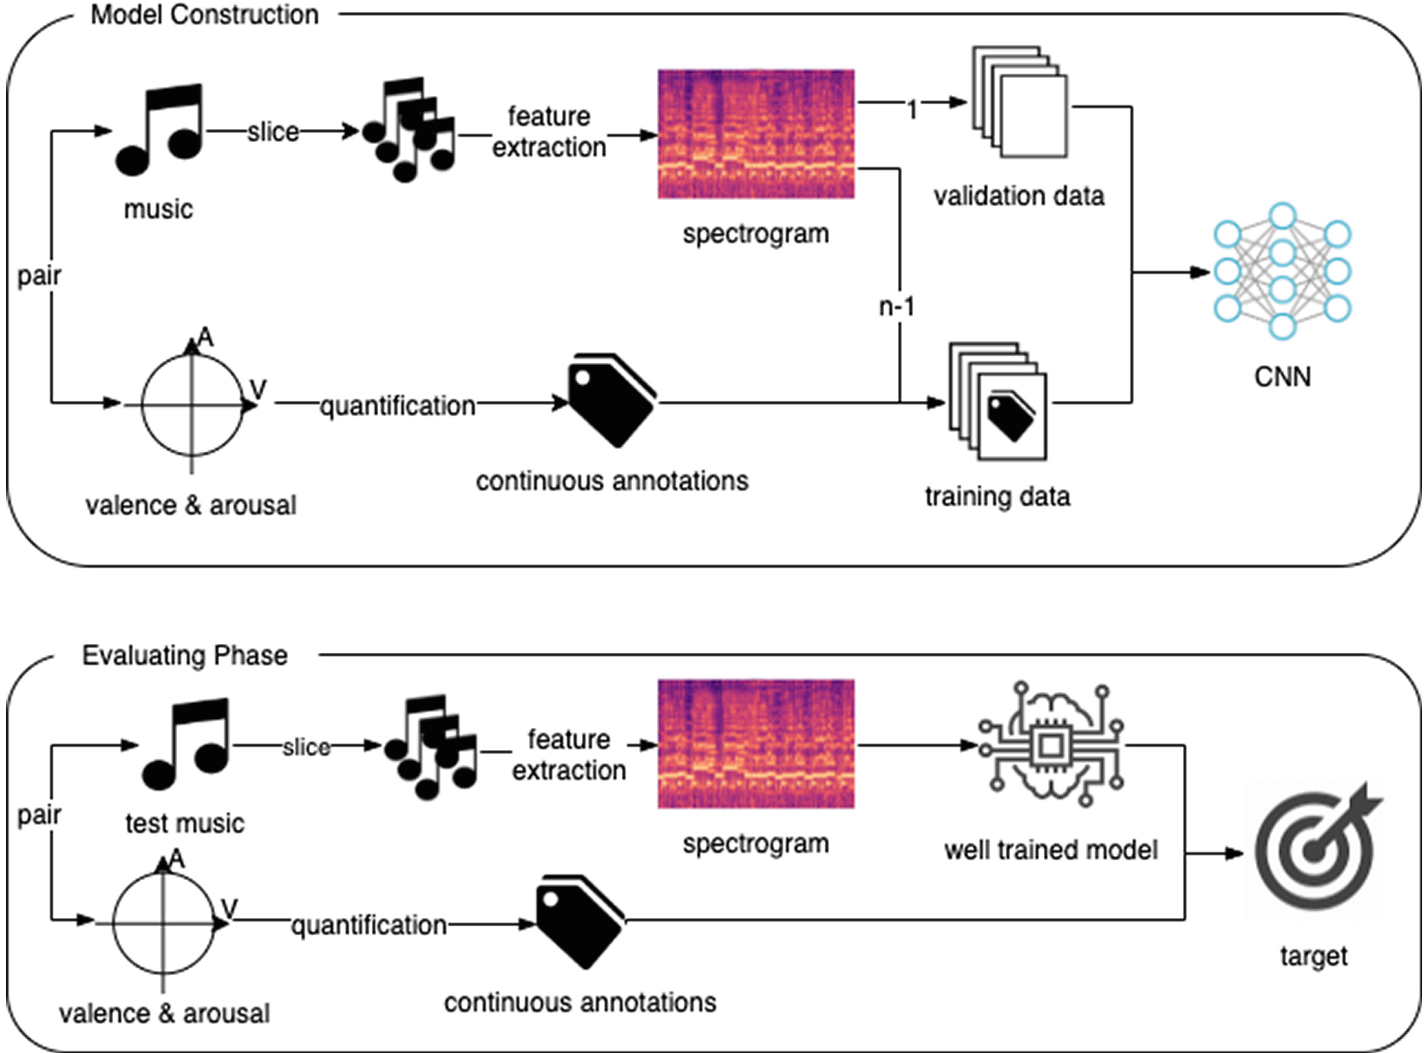 Figure 1: The dual-phase system architecture for model construction and evaluation.
Experiments & Key Insights
The model was trained on the EmoMusic dataset (1,000 songs).
CQT vs. The Rest
When compared to STFT and MFCC, CQT was the clear winner. Interestingly, Chroma features (which collapse audio into 12 semitones) performed poorly, suggesting that absolute frequency information—including high and low-end textures—is vital for emotional resonance.
| Features | Valence Acc (%) | Arousal Acc (%) |
|---|---|---|
| STFT | 52.49 | 61.52 |
| CQT | 56.66 | 64.61 |
| MFCC | 42.50 | 47.69 |
Handling Ambiguity with Fuzzy-3
Because emotion thrives in "gray areas," the authors utilized Fuzzy-3 accuracy. If the model predicts a value adjacent to the ground truth (e.g., predicting -0.1 when the label is 0), it is considered correct. Under this more realistic lens, accuracy jumped to over 80%.
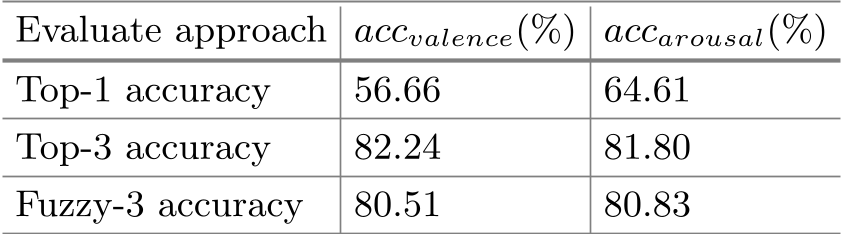 Figure 2: Performance comparison across different evaluation metrics.
Critical Analysis & Conclusion
Takeaway
The success of this work lies in its Inductive Bias: by choosing CQT, the authors aligned the data representation with the physical reality of how humans hear music. This reduced the complexity required in the neural network itself.
Limitations & Future Work
- Quantization: Converting continuous V-A values into 21 discrete bins is a clever "classification hack," but a pure regression approach might eventually offer smoother results.
- Dataset Size: While 1,000 songs is standard for research, real-world deployment would require training on more diverse genres (Global folk, EDM, etc.) to ensure the CNN isn't just picking up on specific production tropes.
In summary, this paper demonstrates that music emotion recognition is as much a signal processing problem as it is a machine learning one. By respecting the logarithmic nature of sound and the temporal nature of feeling, we can bridge the gap between bits and heartbeats.