
Beyond the Schwartz Score: Improving Pediatric LQTS Diagnosis with Naïve Bayes
A Naïve Bayes classifier for differential diagnosis of Long QT Syndrome in children
This study presents a Naïve Bayes machine learning classifier for the differential diagnosis of Long QT Syndrome (LQTS) in children. By mining electronic health records (EHR) to extract 44 clinical features, the model achieves a diagnostic sensitivity of 91.1% and a specificity of 73.3%, significantly outperforming the standard clinical risk assessment tool in early detection.
Executive Summary
TL;DR: Researchers have developed a machine learning-based diagnostic tool for Long QT Syndrome (LQTS) in children that achieves 91.1% sensitivity, uncovering cases that traditional clinical scores frequently miss. By mining 44 distinct features from Electronic Health Records (EHR), the model provides a probabilistic "risk profile" that could serve as a vital early-warning system in primary care.
Background: LQTS is a leading cause of sudden cardiac death in children. Historically, clinicians have relied on the Schwartz Criteria, a point-based system. However, this study reveals a massive gap: over two-thirds of confirmed LQTS patients are classified as "low or intermediate risk" by traditional methods, potentially leaving them at risk without intervention.
The "Conservative Bias" Problem
The diagnostic challenge of LQTS lies in its variability. Some patients show clear QT prolongation on an ECG, while others (concealed LQTS) may have normal intervals but carry a high risk of arrhythmia.
The authors identified that the Schwartz Score—long the gold standard—is failing our youngest patients. In their cohort of 248 confirmed cases:
- 22.6% were flagged as "low risk."
- 44.3% were "intermediate risk."
- Only 33.1% were high risk.
This conservative bias means that a child with a "borderline" score might not receive the life-saving beta-blocker treatment or genetic screening they require.
Methodology: Mining the "Phenotype Space"
The researchers moved beyond simple ECG metrics, building a patient profile consisting of 44 features categorized into demographics, patient history, ECG data, and family history.
Data Extraction & Model Training
Because clinical data is often trapped in unstructured text (physician letters, discharge summaries), the team used a hybrid approach:
- SQL Queries: For structured data like age and gender.
- Expert Annotation: For "hidden" symptoms like T-wave notching or family histories mentioned in clinical notes.
They selected the Naïve Bayes Classifier for its robustness. Despite the "naïve" assumption that all features (like syncope and QTc length) are independent, this model excels in medical domains where data may be sparse or highly varied.
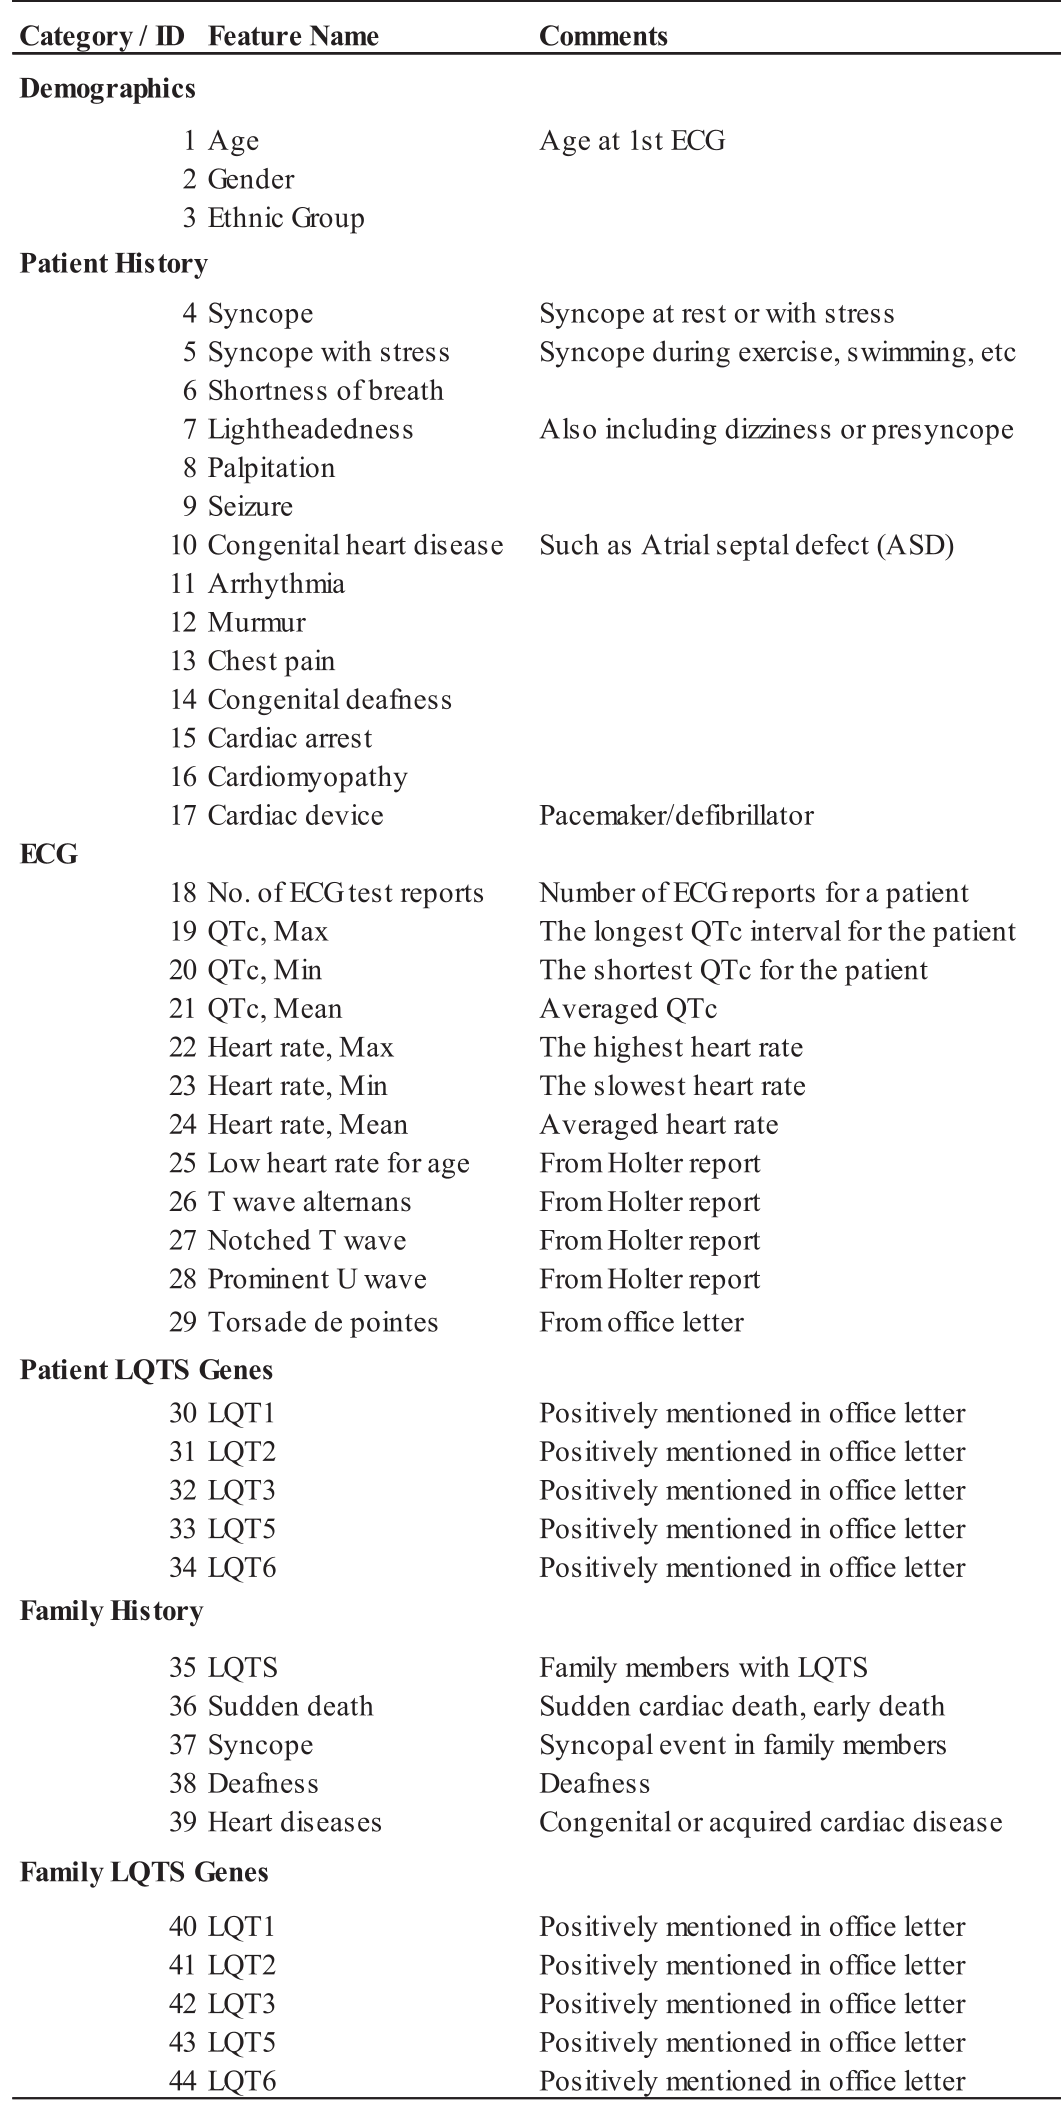 Table 1: The 44 features used to build the patient profile, ranging from ECG intervals to genetic markers.
Experimental Results: Sensitivity is Key
The model was validated using 10-fold cross-validation on a dataset of 349 patients.
- Sensitivity: 91.1% (Success in identifying confirmed LQTS).
- Specificity: 73.3% (Success in identifying healthy/ruled-out individuals).
- Discovery: Sinus bradycardia (low heart rate) for age was found to be a massive "enriched" feature in confirmed patients, often recorded even before medication started.
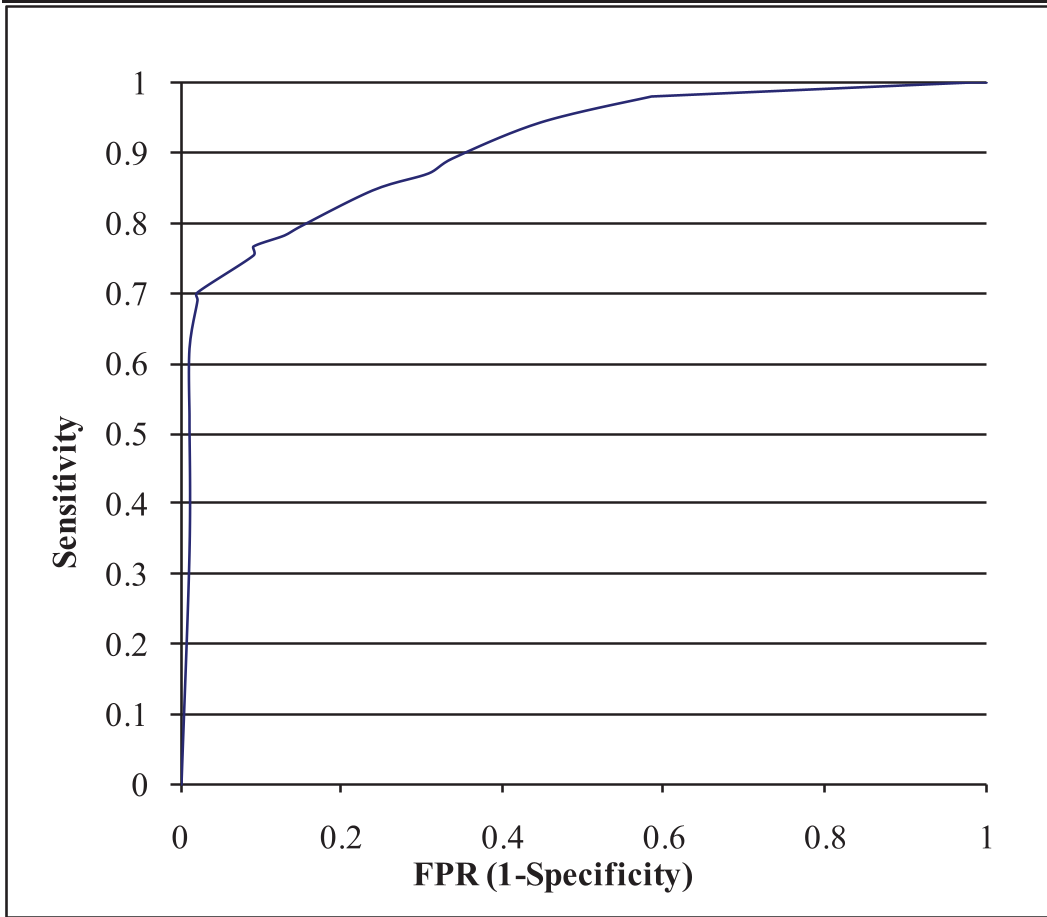 Figure 1: The ROC curve demonstrates that the system achieves high sensitivity (top left) while maintaining a low false-positive rate (error) in the initial threshold range.
Critical Insight: Why Machine Learning Wins Here
The "magic" of the Bayesian approach in this context is its ability to handle integrated evidence. While a single symptom (like a prominent U-wave) might not trigger a "high risk" Schwartz score, the Naïve Bayes model aggregates these weak signals.
For example, for the 15 patients with near-normal QTc intervals (below 420ms), the model could still flag them based on a combination of family history, bradycardia, and syncope—features that the standard point system might not weigh heavily enough to cross the diagnostic threshold.
Limitations & The Path Forward
While powerful, the model has its hurdles:
- Over-diagnosis: A specificity of 73.3% means a quarter of healthy patients might be flagged for further testing (false positives).
- Data Heterogeneity: The reliance on human experts to annotate physician letters suggests we need better NLP (Natural Language Processing) to make this truly "automated."
Conclusion
This study marks a shift from rigid, rule-based medicine to probabilistic clinical decision support. By acknowledging that the "Schwartz Score" is too conservative for children, the authors have opened the door for machine learning tools that act as a more sensitive safety net, ensuring no child at risk of sudden cardiac death goes unnoticed.
Takeaway: In complex heritable disorders, "naïve" statistical models often provide more practical utility than rigid clinical guidelines by effectively synthesizing diverse, "messy" clinical evidence.