
Decoding Neighborhood Effects: Why Your Home Location Governs Your Digital Check-ins
On Neighborhood Effects in Location-Based Social Networks
This paper investigates the neighborhood effects on user check-in behavior in Location-Based Social Networks (LBSNs) using a Foursquare dataset from Singapore. It proposes supervised regression and classification models to predict check-in counts and binary check-in decisions by integrating features from users, venues, social networks, and spatial neighborhoods.
TL;DR
Where you live determines where you go more than who you know. This study analyzes a year’s worth of Foursquare data in Singapore to prove that exact home locations are significantly more predictive of check-in behavior than the commonly used "center of mass" metric. By using supervised learning, the researchers achieved nearly 79% accuracy in predicting whether a user would visit a specific venue.
Context & Motivation
In the world of Location-Based Social Networks (LBSNs), researchers have long tried to predict user movement to power better recommendation engines and urban planning. However, most studies suffer from a "blur" in user location, relying on the Center of Mass (CoM)—the average of all check-in coordinates—to guess where a user lives.
The authors of this paper argue that CoM is a noisy proxy. If you check in at work and at the gym, your CoM might end up in the middle of a lake where no one lives. By identifying true home locations via a "Home (private)" category and linguistic cues (e.g., "finally home"), this paper sets a new standard for spatial precision in LBSN analysis.
The Core Insight: Is Geography Destiny?
The research confirms several high-level intuitions with hard data:
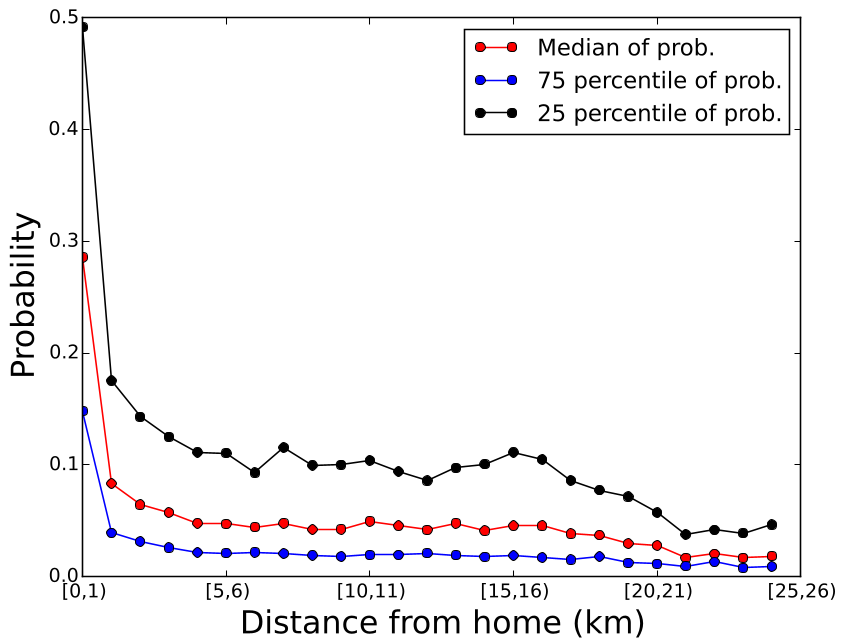
- The Decay of Distance: Check-in probability drops sharply as distance from home increases (see Figure 1).
- The "Active User" Paradox: Active users (those who check in often) are statistically more likely to visit venues farther from their home.
- Neighborhood Similarity: Two users living within 100 meters of each other are twice as likely to share visited venues compared to two random strangers.
Methodology: A Taxonomy of Features
The authors don't just look at distance; they build a comprehensive feature set divided into six categories:
- User/Venue Features: General popularity and activity levels.
- User-Venue (UVF): Specifically, Euclidean distance between the home and the venue.
- Social/Neighbor Features (FVF/NVF): Looking at what your friends or physical neighbors are checking into.
- Complex Features (UVIF): Interactions between a user’s activity level and a venue’s popularity, weighted by the inverse of the distance.
Architecture of Prediction
The paper addresses two tasks:
- Count Prediction (Regression): How many times will you visit? (Handled by Linear Regression and SVR).
- Check-in Prediction (Binary): Will you visit at all? (Handled by Logistic Regression and SVM).
Experimental Battleground: Home vs. Center of Mass
The results clearly show that supervised models excel when they have access to the full feature set ().
| Method | (Center of Mass) | (Home Location) | (All Features) |
|---|---|---|---|
| Logistic Regression | 77.54% | 78.34% | 78.78% |
| SVM | 77.88% | 78.02% | 78.34% |
Interestingly, for Count Prediction, the "Average user's check-in count" () proved to be a surprisingly resilient baseline, nearly matching SVR. This suggests that frequency of habit is a very strong signal in human mobility.
Critical Analysis: What Actually Matters?
By examining the learned weights (coefficients), a fascinating discrepancy emerged:
- In Count Prediction, the most important features were Venue Popularity and the interaction between user activity and distance.
- In Check-in Prediction, the "Familiarity of the venue’s neighborhood" was a top driver.
One surprising finding was the weak influence of social friends (FVF). The authors attribute this to data sparsity—not all friends were in the dataset—but it also suggests that for daily errands, your physical proximity to a venue matters far more than whether a friend "liked" it online.
Future Outlook
This work highlights that for hyper-local businesses, targeting "physical neighbors" may be more effective than targeting "social followers." Future iterations of this research could integrate temporal dynamics (e.g., how the home-effect changes on weekends vs. weekdays) to create truly "context-aware" city models.
Takeaway for Practitioners
If you are building a recommendation engine, home-venue distance is your North Star. If you can’t get home location, the study confirms that the "Center of Mass" is a viable, albeit slightly weaker, alternative.