
Unveiling the "Black Veil": Why Reading Matters as Much as Posting in Online Groups
Network analysis of trace data for the support of group work: activity patterns in a completely online course
This study presents a novel approach to analyzing online group work by utilizing bi-directional trace data (recording both "posts" and "reads"). By applying Social Network Analysis (SNA) and Grounded Theory to a 16-student online course, it characterizes how network structures evolve across different activity types (individual, small group, and peer-to-peer).
TL;DR
Online education researchers often suffer from a "visibility bias," focusing only on who speaks while ignoring who listens. This paper demonstrates that by tracking reading activity (bi-directional logs) alongside posting, we can visualize the hidden social architecture of a course. The study proves that network structures shift dramatically based on whether a task is individual or group-based, and that "silent" members—lurkers—play a measurable role in the network's health.
The Problem: The Invisibility of Passive Participation
In a physical classroom, an instructor can see if a student is attentive, even if they never raise their hand. In the digital realm, however, we historically rely on "uni-directional" data: comments, posts, and uploads.
If a student reads 50 posts but writes none, traditional analytics label them "inactive." This study argues that this is a fundamental misunderstanding of social capital. To truly understand the "engines of knowledge building," we must measure both sides of the communication coin.
Methodology: Mapping the Invisible
The researchers used a system called CANS (Context-aware Activity Notification System) to capture every "read" and "post" event in a 16-week software design course.
They analyzed the data through three lenses:
- SNA Statistics: Measuring density (how connected is the class?), betweenness (who are the connectors?), and centralization (is power concentrated?).
- Qualitative Coding: Triangulating logs with interview transcripts and discussion content to see if the math matched the human experience.
- Sociograms: Visualizing the "cliques" that form when groups are assigned versus when they are left to their own devices.
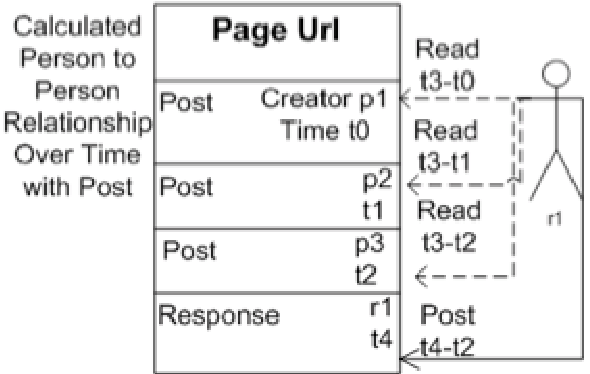 Figure 1: The mechanism for recording bi-directional ties—linking readers to posters.
Key Insights: How Activity Changes Structure
The most striking finding was how Activity Type dictates the social landscape:
- Individual Activities = High Density: Counter-intuitively, when students worked alone, they interacted more broadly across the whole class. They sought out diverse perspectives.
- Small Group Activities = Focus & Silos: Once assigned to groups, students developed a "tunnel vision," focusing almost exclusively on their teammates. The overall network density dropped significantly.
- The "Group Creator": Through Betweenness Centrality, the authors identified specific individuals (like "mem16") who weren't just active, but acted as "bridges" between different topical threads, essentially sparking the formation of ad-hoc communities.
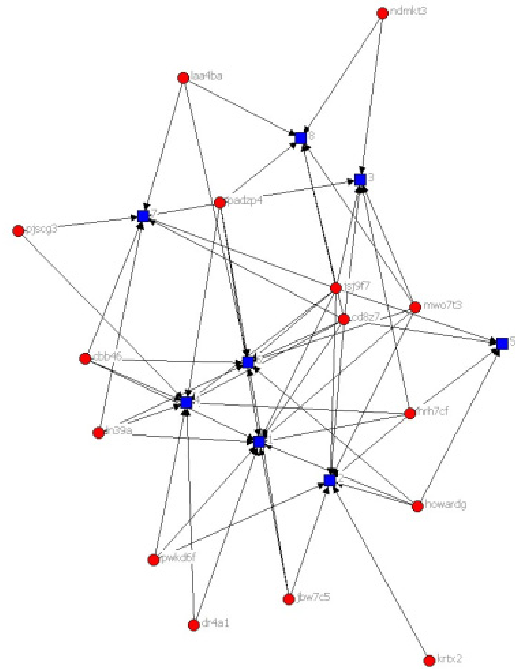 Figure 2: Visualization of 1-cliques showing overlapping membership during small group activities.
SOTA Comparison: Uni-directional vs. Bi-directional
The authors explicitly compared their results against traditional "post-only" analysis. The difference was startling:
- Post-only data failed to reveal side groups or the presence of "thought leaders" who influenced others through their widely-read posts.
- Bi-directional data showed that some "lurkers" had high betweenness, meaning they were deeply integrated into the course's information flow, even if they weren't vocal.
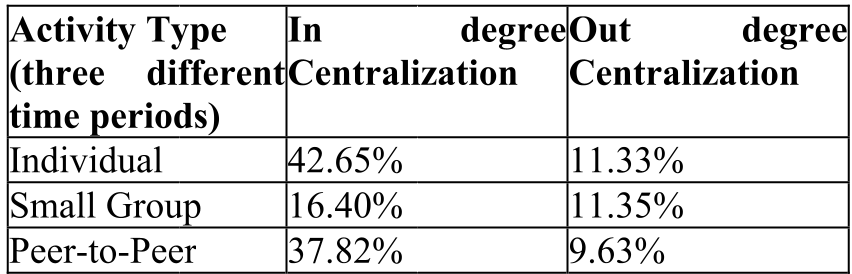 Table 1: Network Centralization showing how readership (In-degree) is much more centralized than posting (Out-degree).
Critical Analysis & Future Outlook
This work challenges the "silence equals absence" myth in online learning. It introduces the "Group Creator" and "Lurker" as quantifiable roles.
Limitations: The study is based on a small sample (N=16). While the depth of the data is impressive, scaling this type of bi-directional analysis to MOOCs (Massive Open Online Courses) with thousands of students would require more automated, high-performance SNA algorithms.
Takeaway for Designers: If you are building collaboration software, don't just track "contributions." Track "consumption." Making these patterns visible to instructors could allow them to coach "peripheral" members toward the "core" before they drop out.
Future research should investigate the predictive power of these metrics: can we spot a failing group three weeks before they miss a deadline simply by looking at their "read" patterns?