
Automated QoE Evaluation: Why Your 3G YouTube Might Feel "As Good" As LTE
Network Performance Testing System Integrating Models for Automatic QoE Evaluation of Popular Services: YouTube and Facebook
This paper presents an automated network performance testing system designed for smartphones to evaluate the Quality of Experience (QoE) of YouTube and Facebook services. Using an Android-based probing application and centralized analytics, the system maps objective application-layer metrics to Mean Opinion Scores (MOS), providing network operators with a tool to assess user satisfaction across 3G and LTE technologies.
TL;DR
Mobile network operators have long struggled to translate "Megabits per second" into "User Satisfaction." This paper introduces a sophisticated Android-based testing system that automates Quality of Experience (QoE) measurements for YouTube and Facebook. By shifting the focus from raw network data (QoS) to application-layer events (APM), the authors reveal a counter-intuitive truth: because of server-side adaptation, higher network speeds don't always result in higher subjective "quality scores."
The Gap Between Speed and Satisfaction
Historically, network "health" was measured by packet loss, jitter, and throughput. However, a user watching a 1080p video on LTE who experiences a single "pause" might rate their experience worse than a 3G user watching a smooth 360p video.
The authors identify two major flaws in existing testing:
- The Human Factor: Surveys are expensive and subjective.
- Context Blindness: Standard models treat a text comment upload and a 50MB video upload with the same delay penalty, ignoring that users expect high-res videos to take longer.
Methodology: Probing the App Layers
The core of this research is a custom Android App that bypasses generic network stats to "spy" on how the app itself is behaving.
YouTube: The State Machine Approach
For YouTube, the system uses the YouTube Player API to monitor the player’s internal state (Unstarted, Buffering, Playing, Paused). It calculates:
- Initial Buffering Time ()
- Rebuffering Frequency (): This is identified as the most damaging factor to QoE.
- Mean Rebuffering Time ()
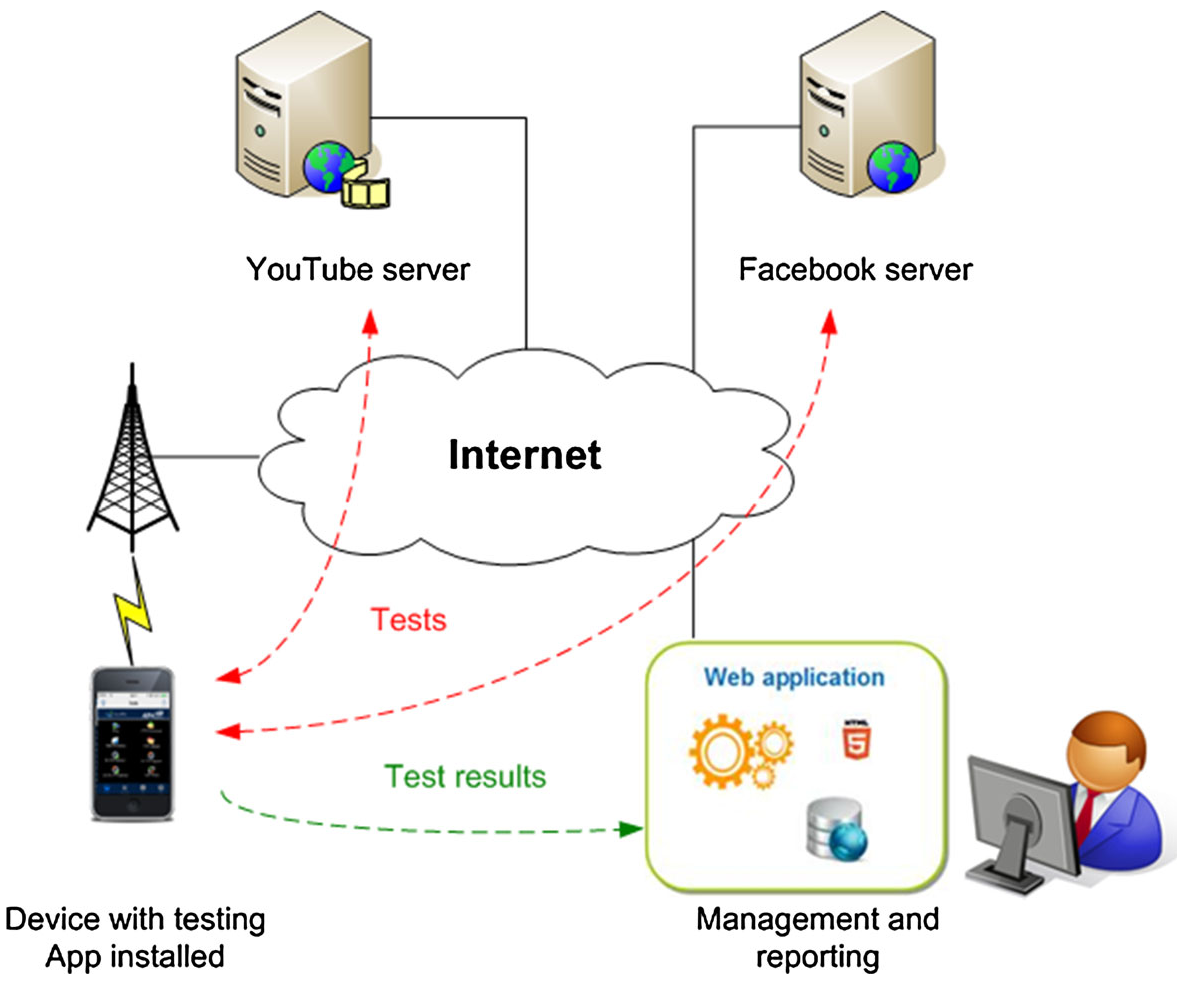 Figure 1: The architecture connects the Android probing app to a centralized database for geospatial and performance analysis.
Facebook: The Content-Aware Model
For Facebook, the authors propose a modified MOS expression. The breakthrough here is the introduction of a sensitivity parameter .
- For Text: (Low tolerance for delay).
- For Photos: .
- For Video: (High tolerance; users expect a wait).
Experimental Insights: LTE vs. 3G
The researchers took their system "into the wild" in Málaga, Spain, testing on both 3G (UMTS/HSPA+) and LTE.
The YouTube Paradox
The data showed that LTE provided a 3x higher data rate and allowed for 1080p streaming. However, the final MOS (Mean Opinion Score) for 3G was slightly higher (3.88 vs 3.85).
Why? The YouTube server automatically detects the 3G connection and serves a lower-bitrate video. Because the 3G connection was stable enough for that lower quality, it resulted in zero rebuffering events. The user gets an inferior image but a smoother experience, which the model ranks highly.
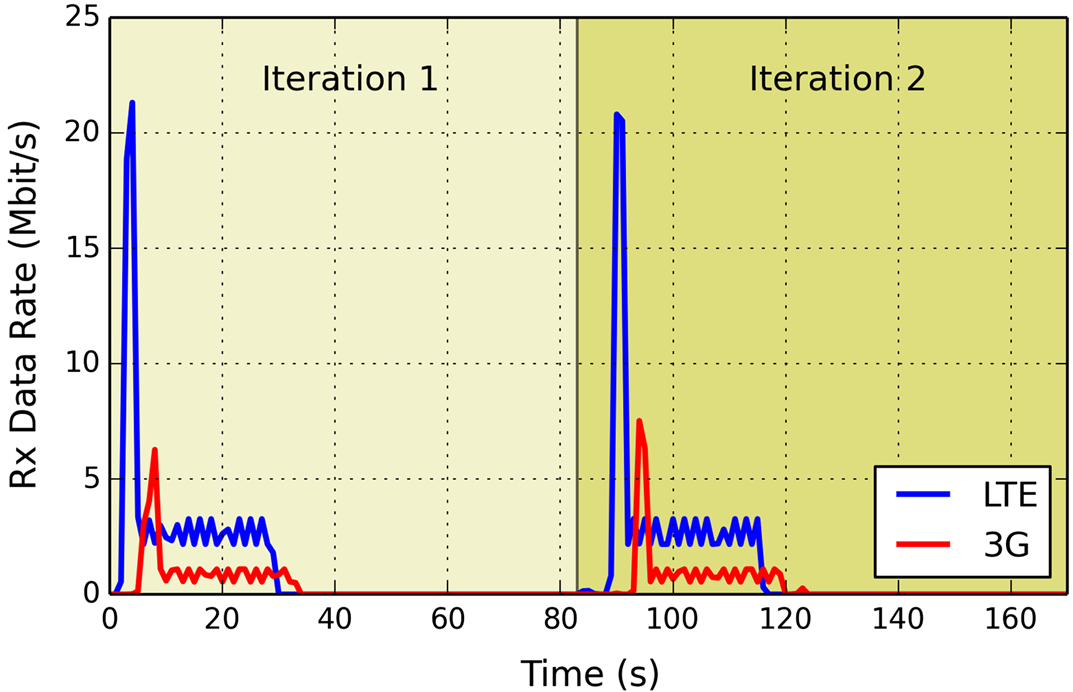 Figure 2: Instantaneous data rate comparison showing the initial burst and the subsequent "throttling" phase used by YouTube.
Facebook Upload Realities
In Facebook testing, LTE significantly outperformed 3G. Uploading a MB video took ~45 seconds on LTE but nearly 200 seconds on 3G. The modified alpha-model correctly adjusted the MOS to reflect that a 45-second wait for a large video is "Excellent" for a mobile user, whereas a 45-second wait for a text comment would be "Bad."
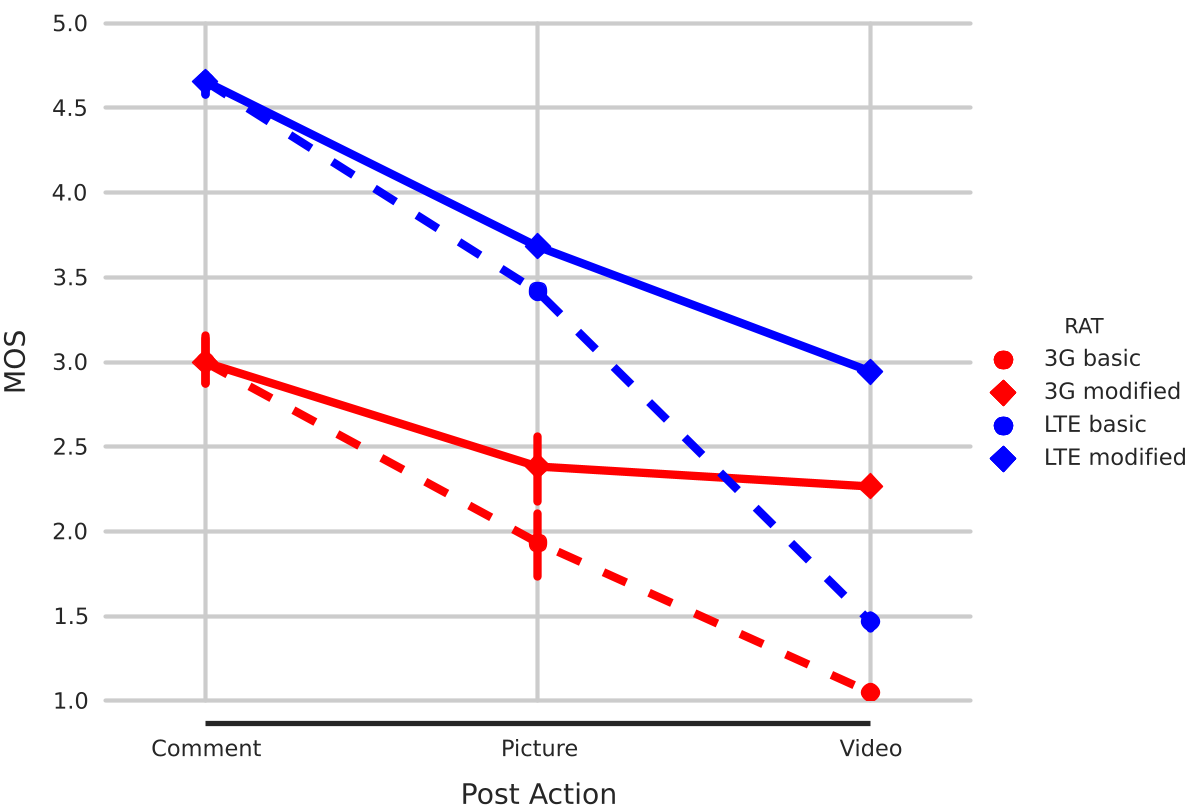 Figure 3: Comparison of the standard MOS model vs. the authors' proposed content-aware model (dashed vs. solid lines).
Critical Analysis & Conclusion
This work highlights the necessity of End-to-End (E2E) visibility.
Limitations
- Image Quality vs. Smoothness: The current YouTube MOS model focuses on playback continuity. It does not penalize the system for serving "pixelated" video on 3G, which is a significant part of the real user experience.
- Protocol Shifts: Since 2015, protocols like QUIC have changed how these apps behave, likely requiring updates to the state-machine logic.
Takeaway
For developers and network engineers, the message is clear: user perception is non-linear. Optimizing for the highest possible throughput is less important than minimizing "rebuffering events" and aligning service response times with user psychological expectations for different content types.