
Gender Dynamics in E-Science: Bridging the Visibility Gap with Webometrics
New indicators for gender studies in Web networks
This paper introduces a novel framework of Web-based indicators for gender studies, specifically targeting collaboration networks within the COLLNET research group. It utilizes Social Network Analysis (SNA) and webometric methods to measure gender-specific participation, contribution, and network centrality, ultimately highlighting shifts in gender equality within "E-science."
TL;DR
Is the shift toward digital "E-science" leveling the playing field for women in research? This study examines the COLLNET network using new Web Indicators and Social Network Analysis (SNA). It finds that while female scientists are reaching the "center" of social and organizational networks, their publications—specifically male-only ones—still command higher visibility on the open Web.
Background: The Rise of E-Science
Traditional metrics for measuring scientific success have long painted a bleak picture of gender parity. Historically, women have published less, collaborated less, and been cited less. However, the authors argue that the transition to E-science—where communication happens via websites, digital repositories, and online networks—requires a new set of tools. They propose Webometrics as a way to measure visibility that traditional databases like the Science Citation Index (SCI) might miss.
Methodology: Beyond Simple Citation Counts
The study pivots on two pillars: Gender Co-operation Indicators and SNA Centrality.
1. The Web Visibility Framework
The authors adapted traditional bibliometric counts into "Web Visibility" metrics. A publication is considered "visible" if its title appears on at least one website discovered via search engines (Google or Alltheweb).
- Visibility of Participation: Counts publications with at least one author of a specific gender.
- Web Visibility Rate (WVP): A more granular measure taking into account the frequency of different websites mentioning the work.
2. Social Network Analysis (SNA)
To understand the power or influence of individuals, the study tracks two types of centrality:
- Degree Centrality: How many direct collaborators an author has.
- Betweenness Centrality: How often an author acts as a "bridge" or "gatekeeper" between different research groups.

Core Findings: The Equality Paradox
The "Visibility Gap"
The most striking result is the disparity in Web impact. When looking at the Average Web Visibility Rate (WVP'):
- Male-only publications: 4.1
- Female-only publications: 2.09
- Mixed-gender publications: 2.11
Even within a progressive network like COLLNET, publications authored exclusively by men are mentioned on nearly twice as many unique websites as those involving women. This suggests a lingering "Digital Matthew Effect," where male-authored work receives disproportionate online attention.
The Centrality of Women
Conversely, the SNA results offer a more optimistic view of organizational structure. In the fourth stage of the network's development (2001-2003), women like H. Kretschmer and L. Liang emerged as the most central actors in the network.
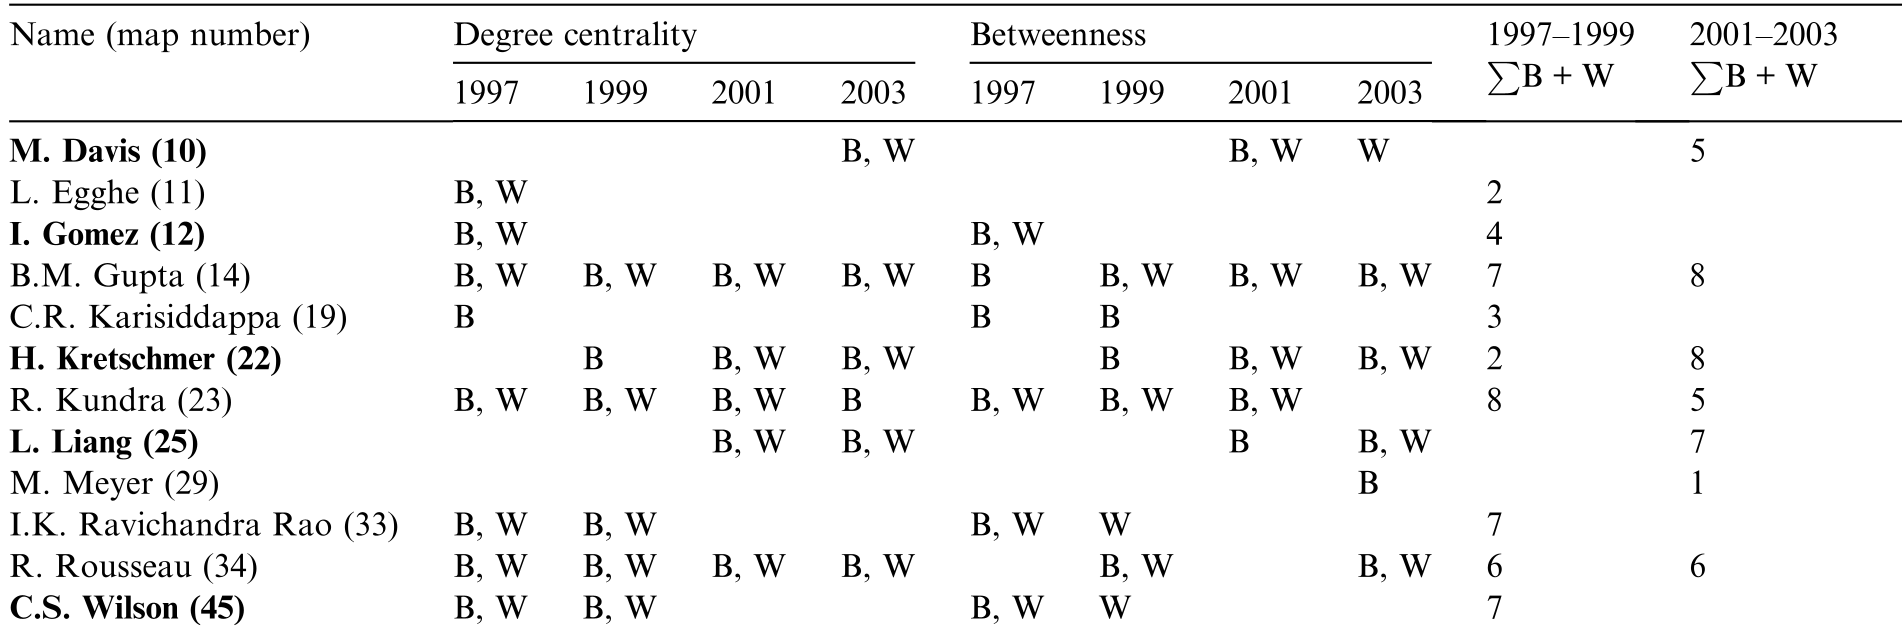
As shown in the table above (where female names are bolded), women are not just participants; they are the "connectors" holding the network together. This aligns with modern trends in the International Society for Scientometrics and Informetrics (ISSI), where women have frequently served as Presidents and conference organizers.
Critical Insight: Why the Discrepancy?
The study raises a vital question: If women are just as central to the network as men, why is their work less visible on the Web? The authors suggest two potential paths for future inquiry:
- Work Content: Is there a difference in the type or topic of research that leads to more web mentions for men?
- Systemic Bias: Is there a "special attitude" or implicit bias online that favors male-only research teams?
Conclusion
This study serves as a methodological bridge, proving that Web-based indicators can reveal nuances that traditional bibliometrics ignore. While gender equality in participation is improving, the visibility of that participation remains a frontier for further equity. For researchers and policy-makers, the takeaway is clear: being at the center of a network is only half the battle; ensuring that work is visible across the global digital landscape is the next challenge.
Limitations
- Sample Size: The study focuses on a small, niche group (COLLNET).
- Technological Context: Conducted in 2003-2005, the "Web" analyzed here predates modern social media (Altmetrics).
- Hyperlink Scarcity: The authors found that while many members had homepages, they rarely linked to each other, indicating that "emergent collaboration" via hyperlinks was still in its infancy.