
Decoding the Pulse of the City: How Deep Learning Uncovers Socio-demographic "Borough Fingerprints"
Discovering New Socio-demographic Regional Patterns in Cities
This paper introduces the concept of Socio-demographic Regional Patterns, a new type of urban signature derived from Location-Based Social Networks (LBSNs). By leveraging Deep Belief Networks (DBNs) for topic modeling, the authors successfully classify New York City boroughs with nearly 70% accuracy based solely on weekly crowd activity distributions.
TL;DR
Researchers from IBM Ireland and Trinity College Dublin have demonstrated that cities possess unique "Socio-demographic Regional Patterns" detectable through Deep Learning. By applying Deep Belief Networks (DBNs) to Foursquare check-in data, they can predict which New York City borough a "weekly footprint" belongs to with ~70% accuracy—outperforming traditional linear models and simple topic clustering.
The "Why": Beyond Heatmaps and Simple Clustering
For years, urban planners and social scientists have used GPS and LBSN (Location-Based Social Network) data to visualize city life. However, most prior work focused on what was happening (heatmaps) or who was doing it (user-centric).
The authors identified a gap: Crowd behavioral analysis. The challenge lies in the "unreasonable effectiveness of data"—there is too much noise and sparsity. Traditional methods like PCA or K-means provide shallow insights, failing to see the deep, hierarchical relationships between "Saturday Nightlife at 1 AM" and "Monday Shopping at 5 PM."
Methodology: The Socio-demographic Regional Pattern
The core innovation is the treatment of city regions as documents and activities as words. An "individual-footprint" is defined as a triplet: [Day of Week] - [Activity Category] - [Time Slot].
1. The DBN Architecture
The researchers chose Deep Belief Networks (DBNs) because they automatically learn feature hierarchies. Unlike standard Feed-Forward Neural Networks, DBNs use a two-step process:
- Pre-training: Each layer is treated as a Restricted Boltzmann Machine (RBM), trained unsupervised to reconstruct the input. The bottom layer uses a Replicated Softmax Model (RSM) to handle word count vectors.
- Fine-tuning: The unrolled network is transformed into a Deep Autoencoder and optimized using Conjugate Gradient descent.
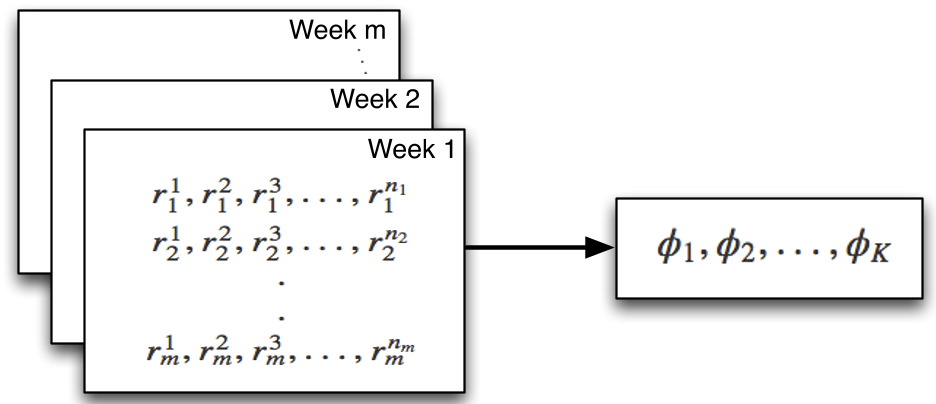 Figure 1: The framework for converting raw LBSN check-ins into high-dimensional latent patterns via DBN.
Experiments: Fingerprinting NYC
The study used 227,428 Foursquare check-ins in NYC, divided into the five boroughs (Manhattan, Brooklyn, Queens, Bronx, Staten Island).
Key Findings:
- Sparsity Matters: Counter-intuitively, the model performed best when "lightweight" weeks (fewer than 300 check-ins) were removed, hitting 68.17% accuracy. This suggests a threshold where the "signal" of a region becomes statistically significant.
- Depth vs. Breadth: Increasing the number of hidden layers beyond 4 did not significantly boost accuracy, indicating that urban patterns might be captured efficiently within a specific hierarchical depth.
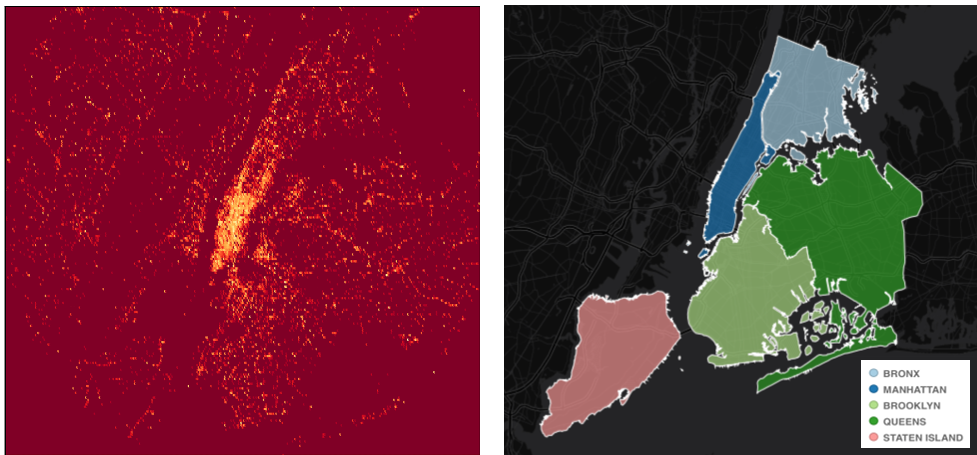 Figure 2: Heatmap of NYC check-ins and the geographical boundaries of the five boroughs used for classification.
Validation: What makes Brooklyn "Brooklyn"?
To peek inside the "black box" of the DBN, the authors used Latent Dirichlet Allocation (LDA) to extract human-readable topics. The results were striking:
- Brooklyn: Dominated by Eating (Topic probability ~0.45).
- Manhattan: Defined by Social Services and professional mid-day activities.
- Queens: Primarily a Traveling hub (Topic probability ~0.63), likely reflecting its role as a residential and transit area.
Critical Analysis & Future Outlook
While the 70% accuracy is impressive for such sparse and uncontrolled data, the model has limitations. It relies on Foursquare users, who represent a specific demographic slice, and it requires high activity density (the "300-word" threshold) to be effective.
The Takeaway: This research moves us closer to "Cognitive Cities." By understanding the unique "footprint" of a district, urban planners can identify "Twin Regions" in different global cities—for example, finding the "Brooklyn of London" or the "Queens of Tokyo"—enabling more precise cross-border urban policy and economic modeling.
Future Work
The next frontier is extending this to multi-modal data, incorporating energy usage and economic indicators to see how socio-demographic patterns drive the physical and financial health of a city.