
Beyond Words: Solving Multilingual Sentiment Analysis with N-Gram Graphs
Using N-Gram Graphs for Sentiment Analysis: An Extended Study on Twitter
This paper presents an extended study of a language-independent Sentiment Analysis framework using the n-gram graphs technique. By representing tweets as graphs of overlapping character sequences and employing an Ensemble Voting system with multiple classifiers, the authors achieve high accuracy across a massive, manually annotated multilingual dataset.
TL;DR
Determining the "vibe" of a tweet is notoriously difficult due to slang, typos, and the sheer variety of languages. This paper moves away from traditional word-counting, instead treating text as a graph of character n-grams. By focusing on the structural relationships between character sequences, the authors built a system that is robust against noise and works across 6+ languages with a high accuracy of ~71%, even when training data is scarce.
Background: The Chaos of the Twitter-verse
Text mining on social media isn't like analyzing a textbook. It’s "dirty" data. The authors identify six core pain points:
- Sparsity: 140 characters provide very little context.
- Non-standard Vocabulary: "Gr8" vs "Great", "Koo" vs "Cool".
- Noise: Grammar is often ignored.
- Multilinguality: Global platforms host a cocktail of languages simultaneously.
Traditional NLP (Natural Language Processing) often relies on "Unigrams" (individual words). But if a word is misspelled, a unigram model fails. If the language changes, the dictionary must change. The authors’ insight? Characters and their relative positions are more stable than words.
The Core Methodology: N-Gram Graphs
Instead of a "Bag of Words," this paper uses N-Gram Graphs.
1. How it works
- Take the phrase "test texts".
- Break it into trigrams:
tes,est,st,t t, etc. - Instead of just counting them, draw an edge between trigrams that appear near each other.
- The weight of the edge represents how often these sequences are neighbors.
2. From Graphs to Features
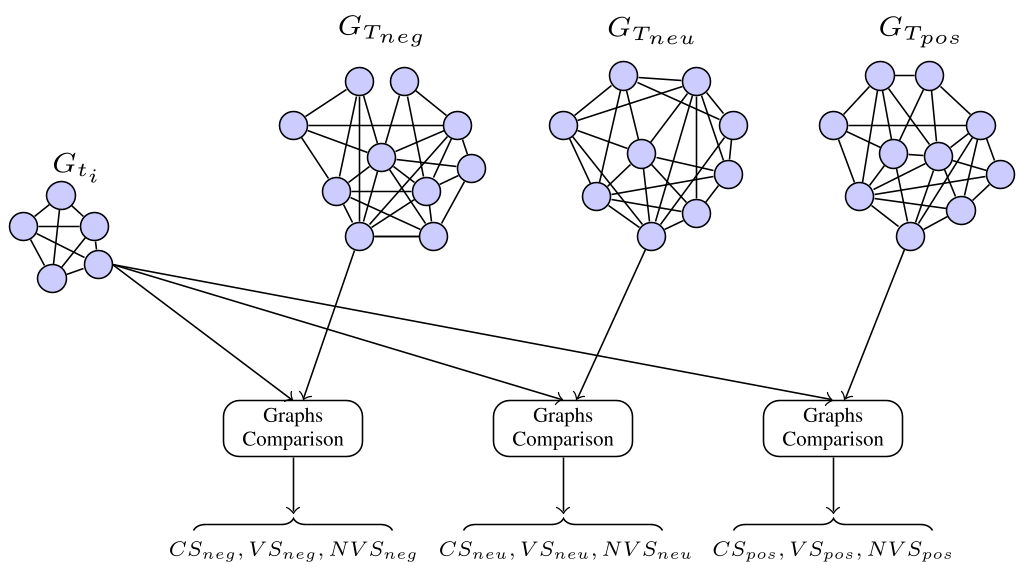
To classify a new tweet, the system compares the "Tweet Graph" to three "Class Graphs" (Positive, Negative, Neutral) built during training. It calculates three specific similarity scores:
- Containment Similarity (CS): Do they share the same edges?
- Value Similarity (VS): Do the shared edges have similar weights?
- Normalized Value Similarity (NVS): A size-agnostic version of VS.
Experimental Results: Strength in Diversity
The authors didn't just use one classifier; they tested six (SVM, Naive Bayes, MLP, etc.) and combined them using Voting Ensembles.
1. Key Performance Metrics
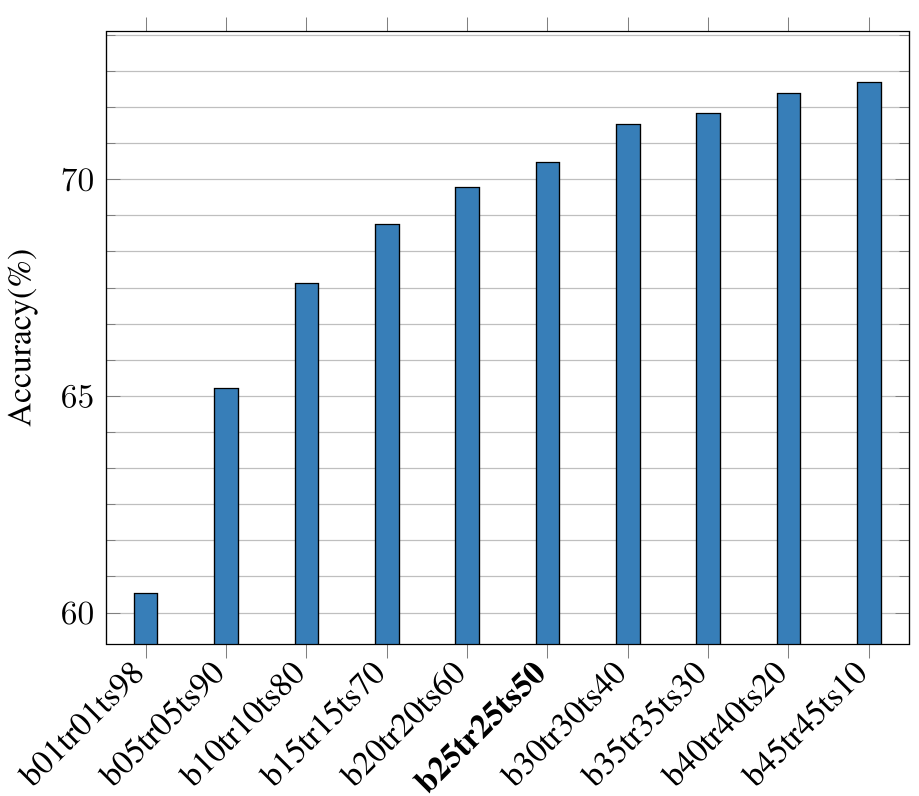
The study used a massive aggregate of 95,608 manually annotated tweets.
- Best Configuration: 4-gram graphs consistently outperformed 3-gram or 5-gram versions.
- Top Accuracy: 71.23% using a weighted vote of MLP, Logistic Regression, and k-NN.
- Language Agnostic: The system performed equally well on Spanish, English, Portuguese, Dutch, German, and French without needing translated dictionaries.
2. The "Discretization" Trick
One of the most interesting findings was that for certain classifiers like Naive Bayes, converting numerical similarity scores into simple nominal labels (e.g., "Positive Score > Negative Score") boosted performance by as much as 27%. This suggests that for noisy social data, the relative rank of sentiment is more important than the absolute value.
Critical Analysis & Conclusion
Takeaways
The n-gram graph approach is a "low-resource" hero. It doesn't need huge GPU clusters or massive pre-trained transformers to understand the sentiment of a misspelled tweet in Dutch. It thrives on the structural signature of language.
Limitations
The primary drawback is computational complexity. Building and comparing graphs for millions of tweets in real-time is significantly slower than simple keyword matching. There is a clear trade-off between the depth of the graph analysis and its throughput.
Future Work
The authors suggest that the next frontier is "denoising"—removing the common subgraphs (the "stop-words" of the graph world) that appear in all sentiment classes to further sharpen the classification boundaries.
Final Verdict: A robust, mathematically elegant alternative to dictionary-based sentiment analysis that proves you don't always need to "understand" a language to "feel" its sentiment.