
Reconciling Graph Density: Why Simple Math Fails Social Network Modeling
Node Degree Distribution in Affiliation Graphs for Social Network Density Modeling
This paper investigates the relationship between bipartite affiliation networks and the density of their projected unipartite social networks. The authors propose a density estimation procedure using a mixture of Zipf and geometric distributions to more accurately predict the number of edges in projected graphs compared to the classic Newman's formula.
TL;DR
The density of social networks—how many connections we actually form—is often far lower than what standard mathematical models predict. This paper identifies the root cause in the "local tree-like structure" assumption used in classic formulas and introduces a more robust estimation procedure using a mixture of Zipf and geometric distributions combined with a simulation-based projection algorithm.
The "Projection" Problem
Most social networks are actually projections of affiliation networks. You aren't just "connected" to a colleague; you are both members of the same project (the affiliation). When we project this bipartite structure (Users + Groups) into a unipartite social network (Users only), the number of edges explodes.
For years, researchers used Newman’s formula to predict this density. However, Newman’s math assumes that if you follow a path through a group, you will almost always reach a "new" person (a tree-like structure). In reality, social circles overlap heavily—your co-author on Paper A is very likely your co-author on Paper B. This "overlap" makes the real social network much sparser than the theory suggests.
Methodology: Beyond Simple Power Laws
The authors argue that real-world node degrees don't follow a perfect power law. Instead, they propose a Mixture Distribution model:
This formula allows the model to capture both the "random" connections (exponential/geometric) and the "preferential attachment" hubs (Zipf/Power-law).
The Random Projection Algorithm
Instead of relying on a closed-form equation that assumes infinite growth, the authors use a simulation approach:
- Draw degrees for users and groups from the fitted mixture distributions.
- Connect user edges to groups without assuming every path leads to a unique neighbor.
- Calculate the resulting edges in the projected modality.
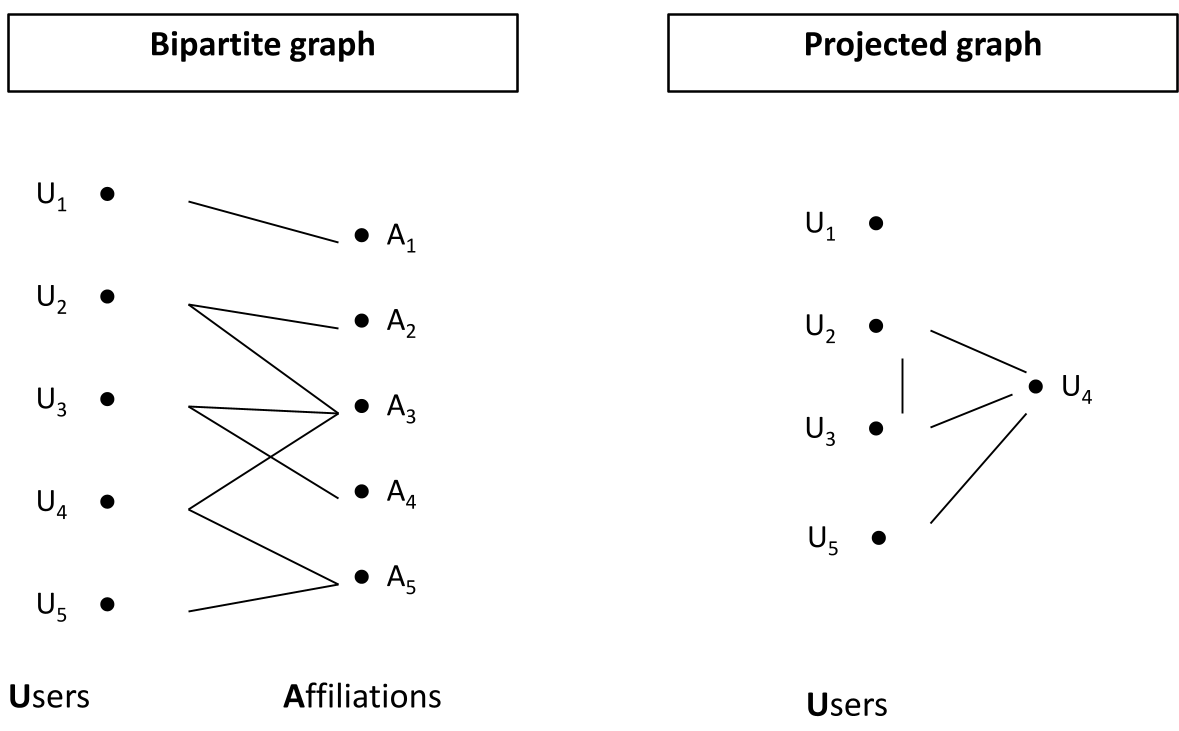 Figure 1: The process of projecting a bipartite affiliation network onto a user-only modality.
Experiments and SOTA Comparison
The authors tested their method against three high-scale datasets: CiteULike, BibSonomy, and IMDB.
| Dataset | Real Edges | Newman's Theoretical | Our Method |
|---|---|---|---|
| IMDB | 30.07M | 81.12M | 30.83M |
| BibSonomy | 1.81M | 23.79M | 2.68M |
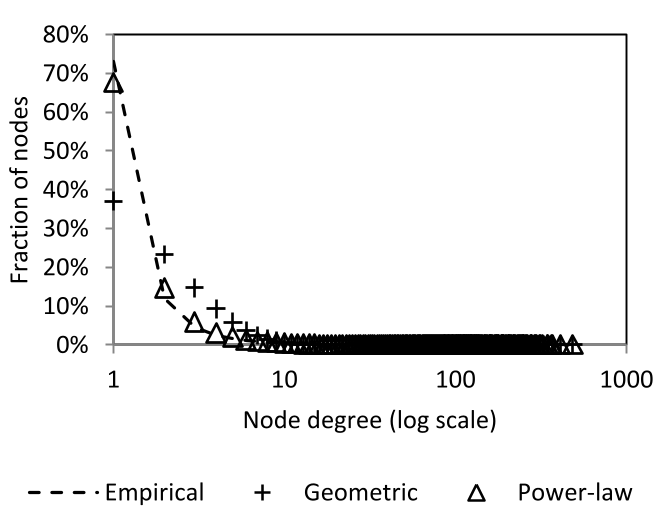 Figure 3: Empirical vs. Fitted distributions. The mixture model (red lines) tracks the real-world data far more closely than single-distribution models.
The results are striking. In the BibSonomy dataset, Newman’s formula was off by a factor of 12.7. The authors' method reduced this discrepancy significantly, and in the case of the IMDB movie database, it predicted the edge count with nearly 99% accuracy.
Critical Insight: The "Clique" Factor
Even with these improvements, the model still slightly overestimates edges in some cases. The authors conclude that real-life "bigraphs" contain local cliques—tight-knit clusters of users who share multiple affiliations. Our social structures are not random; they are redundant.
For developers and data scientists building graph-based recommendation engines or community detection tools, this paper serves as a warning: Never assume your graph is tree-like. If you don't account for the redundancy in human affiliations, your density approximations—and the algorithms built on them—will be fundamentally flawed.
Future Outlook
While the mixture model is a massive step forward, the next frontier is incorporating correlation modeling. High density isn't just about the number of groups we join, but the types of people we keep meeting within those groups. Moving from "Random Projections" to "Correlated Projections" will be the key to perfect social network synthesis.