
Tracking the Pulse of the City: A Two-Stage Spatio-Temporal Event Detection System
A Novel Two-Stage System for Detecting and Tracking Events in Twitter
The paper introduces a novel two-stage system for detecting and tracking events in Twitter by integrating LDA (Latent Dirichlet Allocation) for semantic topic discovery with an efficient density-contour based spatio-temporal clustering approach. The system establishes event continuity through KL-divergence for topics and newly formulated area-weighted distance functions for spatial clusters.
TL;DR
In the era of microblogging, Twitter serves as a global sensor. This paper presents a sophisticated two-stage framework that first extracts semantic topics using Latent Dirichlet Allocation (LDA) and then tracks their physical progression using density-contour based spatio-temporal clustering. By introducing absolute vs. relative density metrics and area-weighted distance functions, the authors provide a robust tool for pinpointing not just what is happening, but where it is moving at varying scales of granularity.
Problem & Motivation: Beyond Simple Heatmaps
Detecting events on Twitter is notoriously difficult because of the "noise" in the data. Traditional methods often encounter two walls:
- Computational Complexity: Parallel processing of space, time, and text simultaneously is often too heavy for real-time streams.
- The Population Bias: Standard heatmaps (absolute density) always highlight big cities like NYC simply because there are more people. We need to find relative density—where an event is significant compared to the local baseline of activity.
The authors' intuition was to separate the "What" (Semantic) from the "Where/When" (Spatio-temporal) in a serial fashion to maintain efficiency while using contour-based math to keep the spatial representation precise.
Methodology: The Two-Stage Pipeline
Stage 1: Semantic Anchoring (LDA)
The system first windows the tweet stream (). It uses LDA to identify latent topics within each window. Unlike simple keyword matching, LDA understands that a "Snow Storm" event might include words like shoveling, closed, stuck, and plow. Each tweet is then labeled with a topic based on posterior probabilities.
Stage 2: Spatio-Temporal Tracking (Density Contours)
This is the "meat" of the innovation. Once tweets are grouped by topic, the system generates Contour Polygon Trees (CPT).
- Absolute vs. Relative: The system uses Kernel Density Estimation (KDE) for absolute density, but also employs a Ratio Risk Function: , where is event density and is general tweet density. This allows them to find a snowstorm in a small town that might otherwise be masked by the noise of a nearby metropolis.
- Continuity: To track an event from Monday to Tuesday, they calculate KL-divergence for the word distributions and a new area-weighted distance function for the polygons.
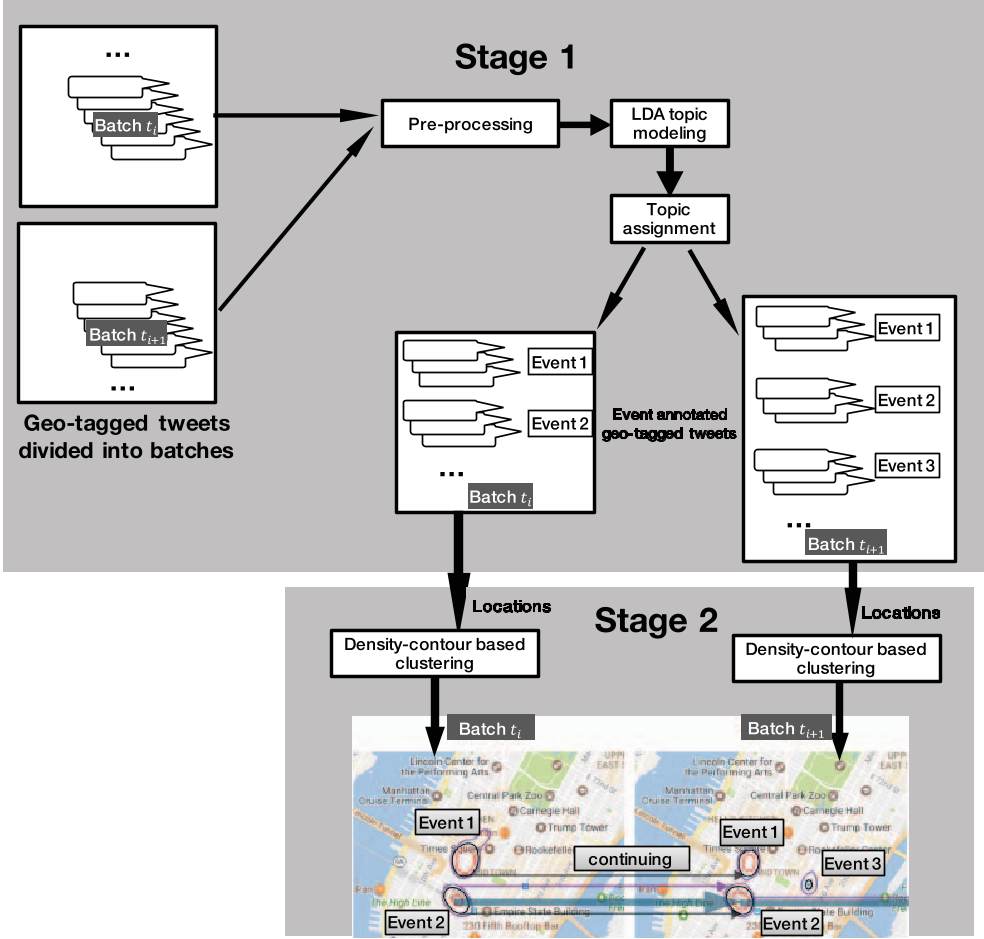 Fig 1: The two-stage architecture integrating LDA and Spatio-Temporal Clustering.
Experiments & Results: Case Studies in Crisis
The system was validated using two significant events: the 2014 Buffalo Snow Storm and the Ferguson Riots.
Case 1: The Buffalo Snow Storm
The system successfully tracked the "shift" in the event. On Nov 17, the word list focused on anticipation (wait, tomorrow, cold). By Nov 19, the semantic focus shifted to impact (stuck, closed, feet, help).
- Insight: Using relative density, the system pinpointed Buffalo as the epicenter, even though NYC had more total "snow" tweets due to its massive population.
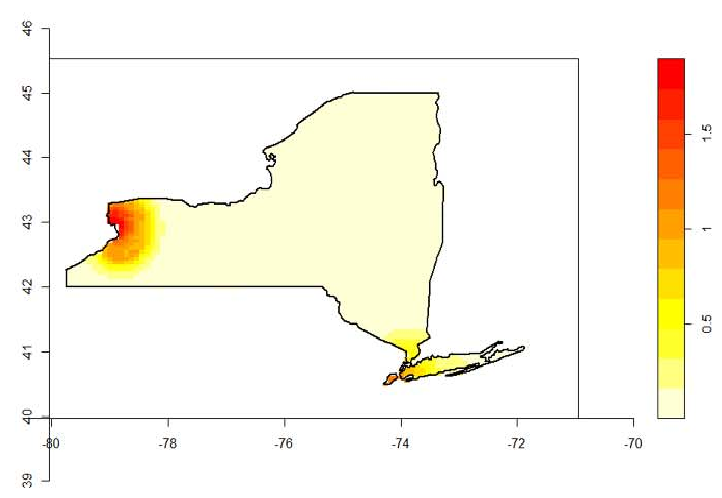 Fig 2: Event clusters in Buffalo. Black arrows indicate continuing contour polygon trees across time.
Case 2: The Ferguson Riots
By applying a Drill Down Operation, the researchers moved from a state-wide view (Missouri) to a city-wide view (St. Louis). In the state view, the event was a single hotspot. Zooming in, the system distinguished between the protest epicenter in Ferguson (high relative density) and general discussion in downtown St. Louis (high absolute density).
Critical Analysis & Conclusion
The core contribution here is the area-weighted similarity metric for polygons, which makes the tracking significantly more robust than previous methods that ignored the physical footprint size.
Limitations:
- The reliance on LDA means the system requires a sufficient volume of tweets per window to form coherent topics.
- Geotagged tweets only represent a small fraction of total Twitter traffic (though they act as a reliable proxy).
Future Work: The authors are moving toward a real-time "trending event engine" capable of visualizing the "rise and fall" of events as a movie—a potential game-changer for emergency responders and urban planners.