
Scaling Soy Monitoring: Fusing OBIA and Data Mining for High-Precision Agriculture
Object Based Image Analysis (OBIA) and Data Mining (DM) in Landsat time series for mapping soybean in intensive agricultural regions
This paper presents a hybrid framework for soybean mapping in intensive agricultural regions by integrating Object-Based Image Analysis (OBIA) and Data Mining (DM) using multitemporal Landsat time-series. By employing the J48 decision tree algorithm on segmented image objects, the study achieved a State-of-the-Art (SOTA) overall accuracy of 95% and a Kappa coefficient of 0.88.
TL;DR
Mapping the rapid expansion of soybean production—which has grown 30x in Brazil over three decades—requires objective, automated tools. This study introduces a robust methodology combining Object-Based Image Analysis (OBIA) and Data Mining (DM). By using J48 decision trees to analyze Landsat time-series data, the authors achieved an impressive 95% accuracy, effectively replacing subjective manual surveys with a reproducible, data-driven workflow.
The Problem: The Expert Knowledge Bottleneck
Traditional Remote Sensing relies on pixel-based classification, which often suffers from "salt-and-pepper" noise. OBIA solves this by grouping pixels into meaningful "objects." However, OBIA introduces a new challenge: Feature Fatigue. An object has hundreds of potential attributes (spectral mean, texture, shape, NDVI, etc.).
How does a researcher know which specific attribute at which specific phenological stage distinguishes a soybean from a sugarcane field? Relying on human experts to build these "semantic networks" manually is slow, prone to bias, and difficult to scale across millions of hectares.
Methodology: The Hybrid Intelligence Approach
The authors propose a "Cognitive Exploratory" workflow that moves from raw pixels to automated knowledge discovery:
- Multiresolution Segmentation: Using the Definiens platform, the team segmented four dates of Landsat 5/7 imagery simultaneously. This ensures that the "object" boundaries are consistent throughout the growing season.
- Multitemporal Feature Stack: Instead of looking at a single snapshot, the model uses a time-series (Sept, Oct, Feb, March). This captures the phenological trajectory of the crop—the unique way soybeans green up and brown down compared to perennial crops like coffee.
- Data Mining (J48 Algorithm): Rather than guessing the rules, the authors fed 396 sample objects into the J48 (C4.5) algorithm. The algorithm automatically selected the most "information-rich" attributes to build a Decision Tree (DT).
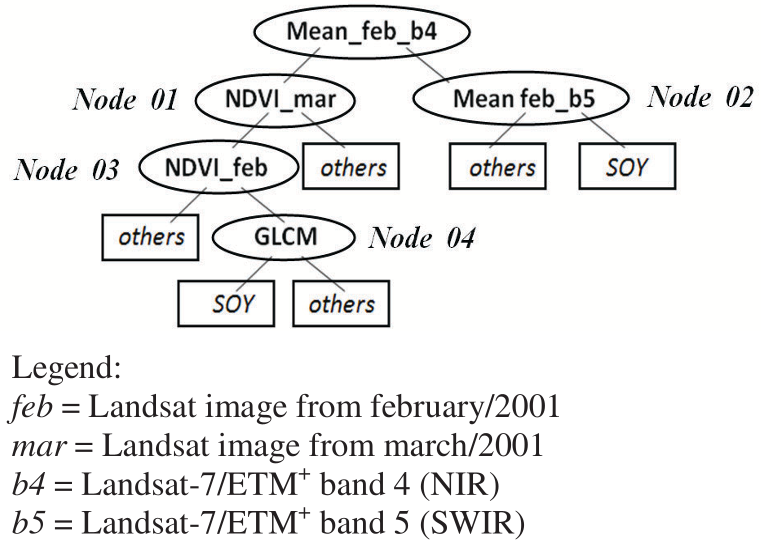 Figure 1: The generated Decision Tree showing the logical flow from NIR Mean to NDVI and Textural (GLCM) features.
Why It Works: The "Physical Intuition" of the Tree
The resulting Decision Tree isn't just a "black box"; it reflects real-world physics:
- Node 0 (Mean_feb_b4): The Near-Infrared (NIR) band in February is the primary splitter, capturing the peak vegetative vigor.
- Node 02 (Mean_feb_b5): The Short-Wave Infrared (SWIR) band proved critical. SWIR is sensitive to leaf water content and soil moisture, allowing the model to separate high-vigor soybeans from other "green" competitors like sugarcane or citrus trees.
- Textural Support (GLCM): When spectral data was ambiguous, the model used GLCM texture to filter out urban areas and wetlands that might mimic agricultural spectral signatures.
Experimental Results: Precision at Scale
The study area in São Paulo State represents a complex mosaic of agriculture. Despite this complexity, the OBIA+DM approach yielded stellar results:
- Overall Accuracy: 95.0%
- Kappa Coefficient: 0.88
- Training Error: Only 3.03% (12 incorrect objects out of 396)
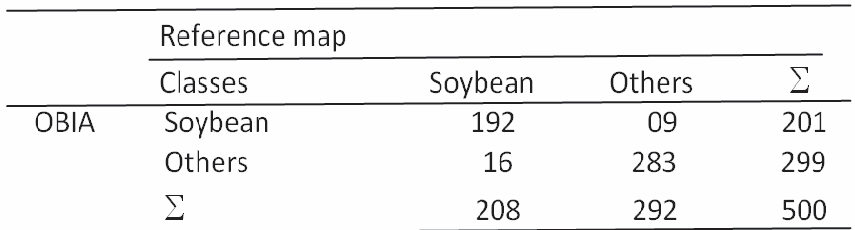 Table 2: The confusion matrix demonstrates extremely low commission errors for the Soybean class.
Critical Insight & Conclusion
The true value of this work lies in the Automation of Semantics. By letting the Data Mining algorithm pick the features, the researchers avoided the "trial and error" phase of manual rule-building.
Key Takeaways for the Industry:
- Temporal is Mandatory: Mapping crops in intensive regions is impossible with single-date imagery. The phenological "rhythm" is the strongest signal.
- OBIA + DM is the Sweet Spot: This combination provides the spatial cleanliness of object-oriented methods with the objective rigor of machine learning.
While the J48 tree is highly effective, future research could explore Random Forests or Gradient Boosting to further improve stability across even larger, more heterogeneous geographic zones.