
One Token Is Enough: Single-Token Distribution Fingerprints as Cheap LLM Forensics
One Token Is Enough: Fingerprinting and Verifying Large Language Models from Single-Token Output Distributions
This work shows that the empirical distributions of single-token answers to trivial prompts are stable behavioral fingerprints of large language models. Across 165 models served through a commercial aggregator, the paper reports an equal error rate of 7.3 percent with the full 40-cell probe battery, 10.6 percent with only eight cells, and family recovery of 59.5 percent leave-one-out accuracy against an 18.4 percent chance baseline.
TL;DR
Bruckner demonstrates that large language models leave a forensic trace in a surprising place: the one-token answer they emit when asked a mundane question such as “name a random number between 1 and 100.” By repeatedly sampling trivial prompts and measuring the resulting categorical distributions, the paper builds a black-box behavioral fingerprint that is cheap enough to audit commercial endpoints at near-zero marginal cost. The full study of 165 OpenRouter-served models shows stable model-specific distributions, lineage recovery at 59.5 percent leave-one-out accuracy versus an 18.4 percent chance rate, and practical verification with equal error rates from 7.3 percent at 40 probe cells to 10.6 percent at eight cells.
Background Positioning
This is neither a watermarking paper nor a high-accuracy text-classifier benchmark. Watermarks and ownership fingerprints, such as the decoding-time watermark of Kirchenbauer et al. or the instruction-tuned backdoor scheme of Xu et al., help the model owner verify their own model. The setting here is third-party client auditing: the client sees only text, pays a small API budget, and wants to know whether the endpoint really serves the advertised checkpoint.
The closest conceptual neighbors are model equality testing, active query-efficient fingerprinting, and statistical auditing of model substitution. Gao et al. provide the empirical alarm: 11 of 31 commercial Llama endpoints were found statistically incompatible with the vendor’s reference weights. Cai et al. formalize substitution threats and show that naive output comparisons are brittle under nondeterminism. LLMmap and TRAP achieve impressive identification with few queries, but rely on engineered or adversarial prompts whose distinctiveness is also their weakness. Bruckner’s proposal occupies a different niche: use completely ordinary prompts, collect only one answer token, and identify the model through the shape of the empirical answer distribution rather than through the uniqueness of a magic string.
Problem and Motivation
The modern inference chain is economically adversarial by default. A client pays for model X, but an aggregator or provider may route the request to a quantized variant, an older snapshot, or a different model entirely. The paper’s threat model is realistic because it does not assume malicious incompetence. An economically rational adversary wants to reduce cost while avoiding detection. It may ignore audit traffic entirely, filter known audit prompts, or even try to emulate the claimed model’s low-entropy behavior.
Existing non-cooperative methods run into at least one practical barrier. Classifier-based attribution of generated text needs long outputs, which costs time, money, and privacy. Methods that use log-probabilities are unavailable on many text-only production endpoints. Adversarial prompt probes can be powerful, but their very signal makes them detectable: a provider that recognizes “that is an audit” can route only those queries to the real model. A robust audit therefore needs probes that are indistinguishable from ordinary traffic and a statistic that remains stable across serving stacks.
The key insight is to invert a known behavioral pathology. Prior literature treats the failure of models to sample uniform random numbers as a deficiency. Bruckner instead asks whether the deficiency is model-specific enough to become identity. The answer is yes: quantization, distillation, tokenizer choices, training priors, and preference tuning all perturb the final softmax landscape sampled by a trivial prompt. The distribution of one-token answers is not noisy in the forensic sense; it is noisy in the way that a biometric signal is noisy—reproducible under the same conditions, yet stable enough to separate different individuals.
Core Analysis: Turning Non-Randomness into Forensics
The Fingerprint Object
The paper defines the unit of evidence as a probe cell, which is a task and language pair such as “favorite color” in Arabic or “random city” in English. For each cell, the endpoint is queried repeatedly at temperature 1.0 with a system prompt enforcing a one-word answer, a hard cap of 16 completion tokens, and provider-side reasoning modes disabled. The raw completion is then normalized into a categorical answer. The result is an empirical answer distribution for each model, task, and language.
Here is a served model checkpoint, is the battery of probe cells, indexes the semantic task, and indexes the prompt language. The symbol is the empirical distribution of normalized single-token answers that model gives to task in language . In the paper’s argument, this tuple is the fingerprint itself: not a vector of weights, not a logits dump, and not a long generation, but a collection of simple categorical histograms. Its role is to reduce the forensic problem to distribution estimation and comparison. If the distribution were identical across models, the object would be useless; if it were unstable under repetition, it could not be enrolled as a reference. The boundary is also clear: the fingerprint excludes refusal and invalidity rates because those can change with safety layers, and it requires enough valid repetitions per cell to make estimation meaningful.
The task battery is deliberately mundane. The paper reports ten tasks in English, Russian, Chinese, and Arabic:
| Task | Answer-space character | Condition |
|---|---|---|
| random number between 1 and 100 | closed numeric space of 100 possible answers | random |
| random number between 1 and 10 | closed numeric space of 10 possible answers | random |
| favorite number | open numeric space | favorite |
| random letter | closed alphabet space | random |
| random word | open lexical space | random |
| random color | open but canonicalized lexical space | random |
| favorite color | open but canonicalized lexical space | favorite |
| random animal | open lexical space | random |
| random city | open lexical space | random |
| coin flip | closed binary space of 2 possible answers | random |
The design choice here is not cosmetic. Closed spaces such as numbers and coin flips expose direct sampling bias over a finite alphabet, while open spaces such as favorite color, animal, and city expose cultural and lexical priors. The random versus favorite contrast is also retained because prior behavioral studies suggest that explicit randomness requests and preference requests can reveal different parts of the model’s distributional habits. Languages multiply independent probe dimensions without requiring new task engineering, and they also probe different slices of training data. The full battery therefore forms 40 cells, and the paper’s verification results later show that useful identity can be obtained from a much smaller subset.
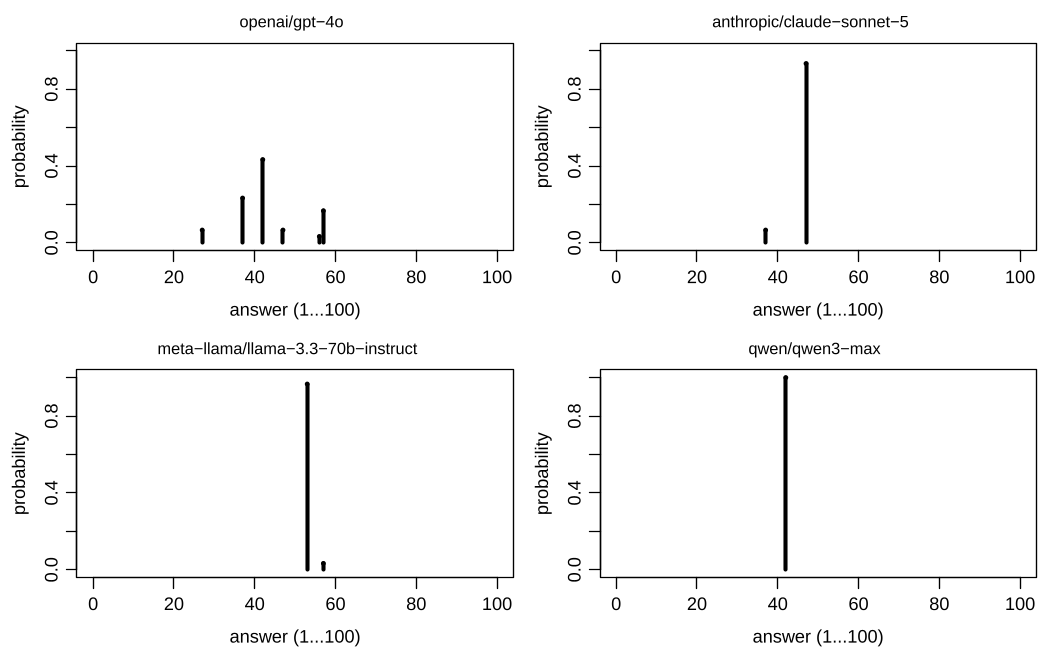
Figure 1 makes the raw signal concrete. For the same English prompt “Name a random number between 1 and 100,” with temperature 1.0 and 30 samples, GPT-4o spreads its answers over values such as 42, 37, and 57, Claude Sonnet 5 concentrates on 47, Llama 3.3 concentrates on 53, and Qwen3-Max answers 42 every single time. The important point is not merely that the models differ, but that each model’s distribution is individually stable enough to be used as evidence. This stability is what turns a behavioral defect into a fingerprint.
Distance, Lineage, and Verification
Once models are represented as collections of categorical distributions, the next question is how to compare them. The paper chooses a straightforward distance: average Jensen-Shannon divergence over cells where both models have at least ten valid samples.
In this formula, is the subset of probe cells with sufficient data, and the average is taken over that subset so that sparse cells do not distort the global comparison. Jensen-Shannon divergence, written with base 2 in the paper, measures the difference between two probability distributions in a symmetric and bounded way. That property matters because sparse categorical distributions are common in small-sample audits: a model may answer several different cities, colors, or numbers, while another may answer almost the same word every time. An asymmetric divergence such as forward KL would place excessive weight on zero-mass regions and would be awkward to average across cells. If JSD were replaced by raw squared difference on normalized counts, the statistic would lose the information-theoretic calibration that makes divergence comparable across cells; if the average over were removed and replaced by summing, cells with more available data would dominate the distance without justification. The chosen form is simple, symmetric, bounded, and well suited to sparse categorical evidence.
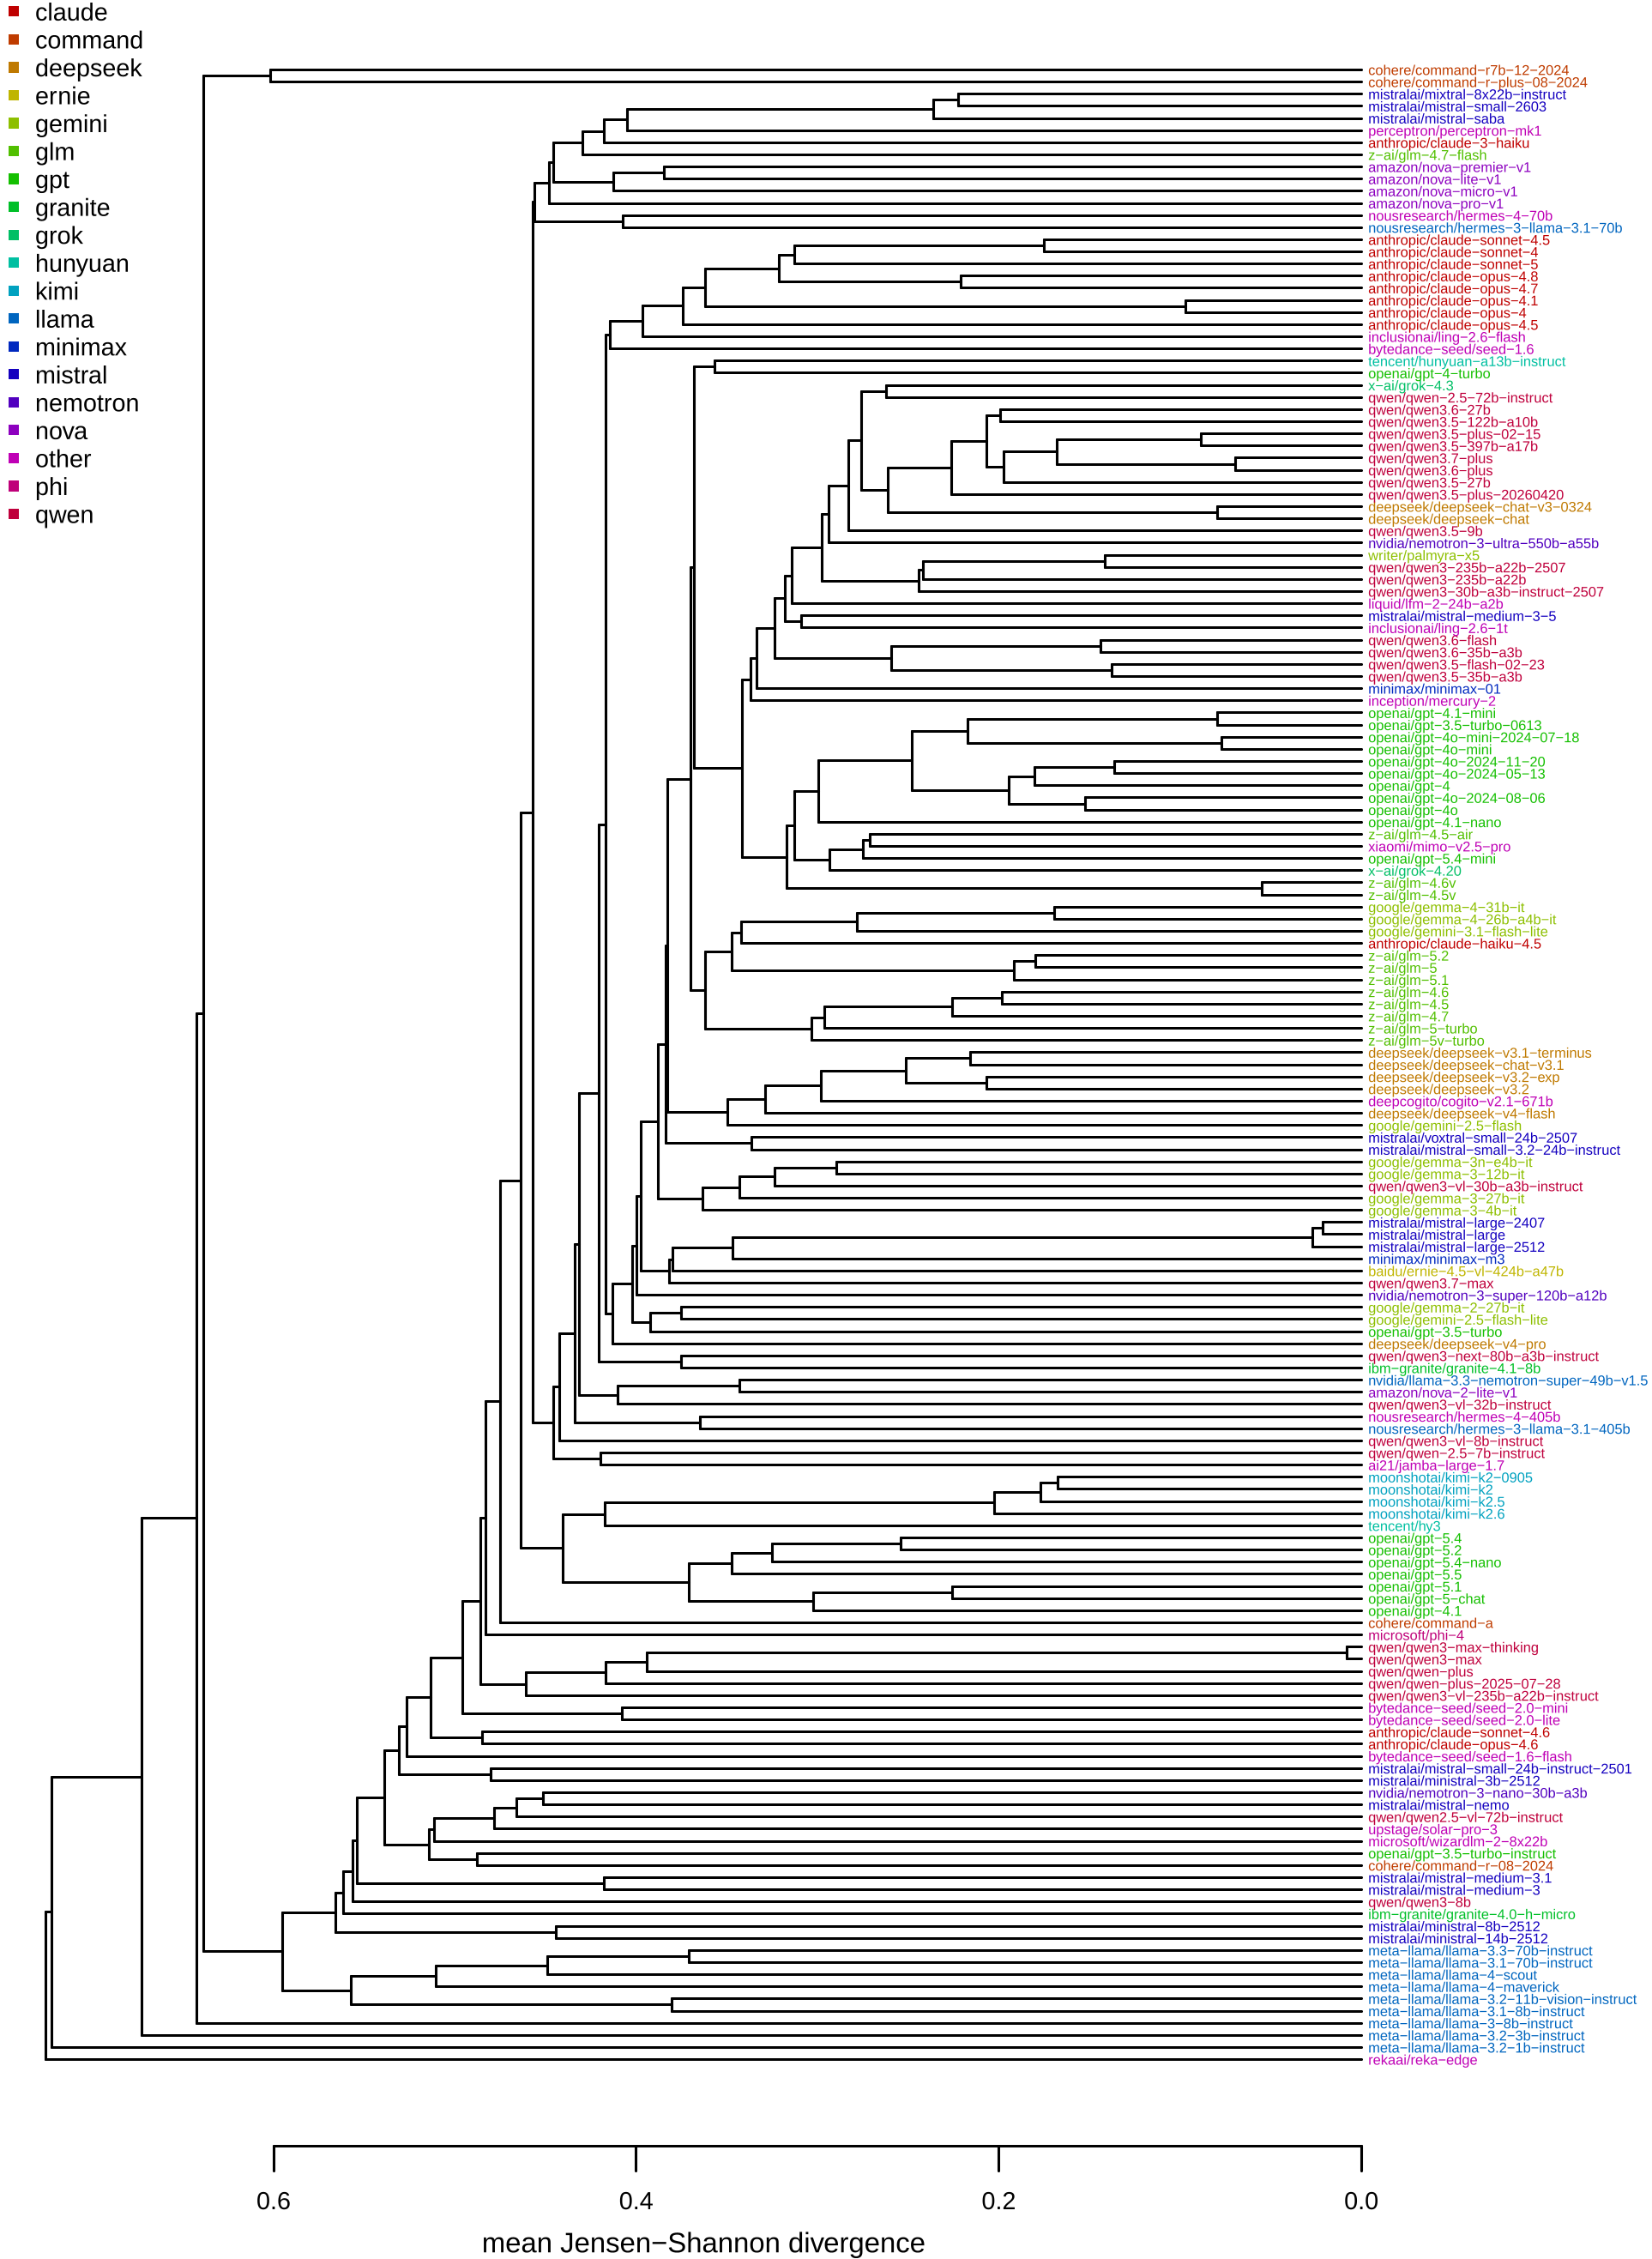
The distance is used for two distinct tasks: lineage recovery and verification. For lineage, the paper clusters the distance matrix with average-linkage hierarchical clustering and compares the resulting tree to documented model families using adjusted Rand index. It also performs nearest-neighbor family classification under leave-one-out validation. For verification, the question becomes endpoint-specific: does served endpoint really provide claimed model ? The verifier enrolls a reference fingerprint of from a trusted deployment, then samples probe cells and computes an averaged divergence.
Here is a sampled subset of probe cells, is the enrolled reference distribution for claimed model , and is the observed endpoint distribution. The claim is accepted if the score is no larger than a threshold . This is the operational heart of the method. The verification is calibrated biometric-style rather than against a single string output: genuine trials compare disjoint halves of samples from the same model, while impostor trials compare samples from different models. The ROC curve sweeps across all endpoints. This design is important because it separates “this endpoint deviates from reference” from “this endpoint is a different model” by treating the reference as a probabilistic profile and the audit as a hypothesis test. If one instead compared a single answer token to a reference mode, the result would be dominated by sampling noise and would produce many false rejects. If one instead used long generated text, the method would become more accurate in some settings but would lose the cost property that makes continuous auditing feasible.
Why Cheap Distributions Carry Identity
The paper gives an intuitive mechanistic account: the distribution of a one-token answer aggregates several layers of model construction. Tokenizer segmentation determines whether “blue,” “Blue,” or a color-word plus punctuation maps to one or several discrete choices. Pretraining corpus frequencies shape which cities, colors, animals, or favorite numbers are salient. Instruction tuning and preference optimization shift the likelihood of terse versus sentence-like answers. Decoding implementation and quantization perturb the final softmax landscape that the probe samples. The forensic value is that quantization and distillation, two economically tempting substitutions, alter precisely the layer visible to a one-token distribution probe.
This also explains why the protocol is more robust to serving-stack changes than to model replacement. The paper reports that replacing the serving provider moves a model’s fingerprint by a median distance of 0.227, less than half the impostor median of 0.463, and keeps cross-provider verification at area under the curve 0.880 compared with 0.971 in same-provider split-half trials. In other words, serving stacks are not identical; the fingerprint is not invariant to infrastructure, but it is often stable enough to tolerate normal provider variation. The minority of provider pairs that diverge beyond the impostor range are precisely the deployments that should be flagged, not quietly averaged away.
The adaptive-provider argument is subtle and partially future-tested. For a T2 adversary that recognizes known audit prompts, the paper’s probe space is not a fixed magic string but a semantic class of everyday questions with unbounded paraphrases and translations. The author argues that the fingerprint is a property of the answer distribution, not of a particular wording, and notes that the battery already realizes each task in four languages. The limitation is explicit: a dedicated paraphrase-invariance experiment is left to future work. For a T3 adversary that tries to emulate the model, the paper makes a strong economic argument: matching conditional answer distributions on arbitrary low-entropy prompts approaches running the claimed model, which erodes the substitution margin. This is not a cryptographic guarantee, and the paper does not claim one; it is a cost-raising forensic mechanism.
Experimental Evidence and Interpretation
The evidence base is unusually concrete for a black-box behavioral fingerprint. The census uses 165 models from a 2026-07-06 OpenRouter catalog snapshot, ten tasks, four languages, 30 repetitions at temperature 1.0 for most models, and three repetitions at temperature 0; frontier-priced models use 15 repetitions at temperature 1.0. The full collection comprises 326,047 responses, 23.3 million input tokens, 1.16 million output tokens, and costs 0.21 per model. Those numbers matter because they convert a forensics paper from “interesting signal” into “deployable audit.” Long-generation classifiers may be highly discriminative, but they are economically awkward for continuous endpoint checking.
The core statistical separation is reported in Sec. VI-A. Across 6,572 census cells with at least ten valid samples, median cell entropy is 1.00 bit and median modal-answer share is 0.71, against uniform-baseline entropies ranging from 1 to 6.64 bits depending on the answer space. This is not a weak uniformity defect; it is a strong prior that models can exploit. The split-half reproducibility is also striking: the median cell-level Jensen-Shannon divergence between two disjoint halves of the same model’s samples is 0.075, versus 0.489 between halves of different models. The paper reports 6,564 genuine versus 1.07 million impostor cell-level trials. These numbers are essential because a fingerprint that exists only in aggregate but vanishes in small subsets would not support cheap auditing.
The lineage results are strong but not uniformly clean. The paper reports leave-one-out nearest-neighbor family assignment accuracy of 59.5 percent against an 18.4 percent chance rate. A family-level table from the released analysis gives more granularity:
| Family | Number of models | Precision | Recall |
|---|---|---|---|
| Qwen | 30 | 0.50 | 0.73 |
| GPT | 21 | 0.70 | 0.90 |
| other | 17 | 0.20 | 0.06 |
| Mistral | 16 | 0.87 | 0.81 |
| Claude | 12 | 0.54 | 0.58 |
| GLM | 12 | 1.00 | 0.83 |
| Llama | 12 | 0.88 | 0.58 |
| Gemini | 11 | 0.43 | 0.55 |
| DeepSeek | 8 | 0.46 | 0.75 |
The pattern is informative. Some families are tightly clustered, such as GLM with precision 1.00 and recall 0.83, or Mistral with precision 0.87 and recall 0.81. Others are more diffuse, including Qwen at precision 0.50 and the “other” bucket at precision 0.20 and recall 0.06. The “other” bucket is especially important: it is not a single model family but a residue of labels that cannot be assigned confidently, so low precision and recall there do not falsify the method. The paper explicitly notes that heavy post-training can erase lineage priors: NVIDIA’s Llama-3.3-Nemotron derivative is closer to Qwen models at distance 0.303 than to any Llama checkpoint, which means that family classification has a ceiling when behavioral ancestry is overwritten.
The verification protocol is the most operational contribution. The paper evaluates genuine trials as split-half comparisons and impostor trials as cross-model comparisons, yielding 165 genuine and 27,060 impostor trials in the main ROC analysis. The full 40-cell battery produces area under the curve 0.971 and equal error rate 7.3 percent. The query-budget curve is summarized in the paper’s table:
| Probe cells | Equal error rate percent | Stability band percent |
|---|---|---|
| 1 | 23.3 | 14 to 40 |
| 4 | 13.2 | 9 to 18 |
| 8 | 10.6 | 8 to 14 |
| 16 | 9.5 | 8 to 12 |
| 32 | 8.4 | 7 to 10 |
| 40 | 7.3 | not reported |
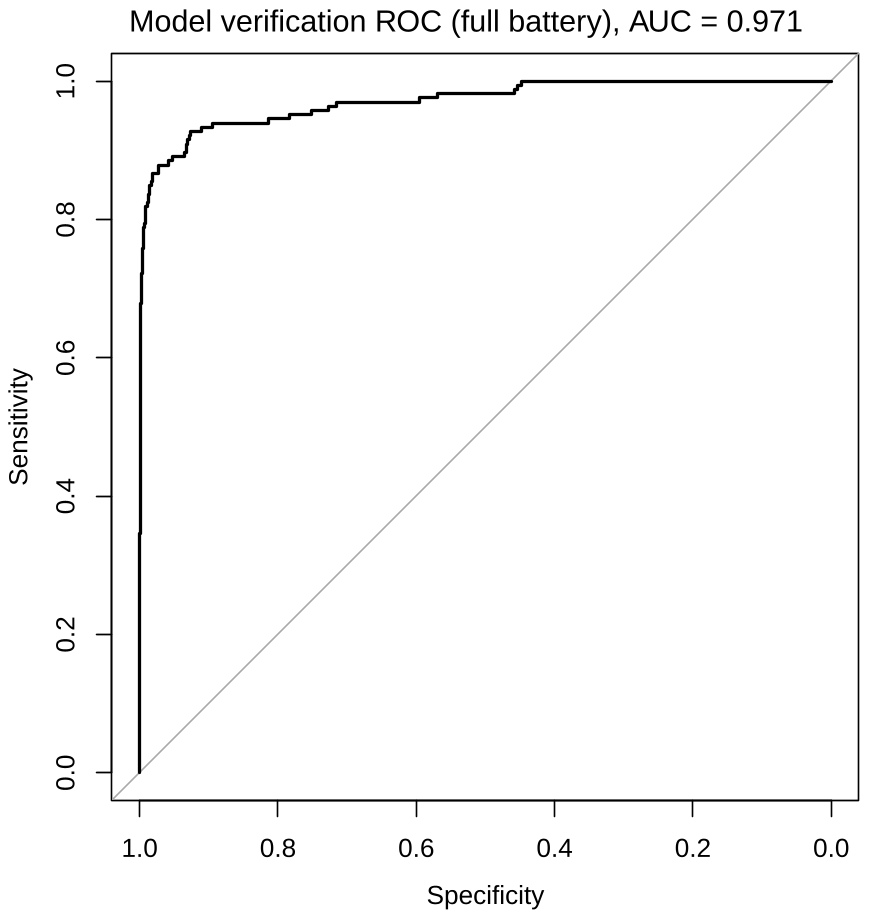
The table shows a steep cost-reliability frontier, but also diminishing returns. One cell already gives some signal, but its error band is wide at 14 to 40 percent. Eight cells bring the equal error rate to 10.6 percent, and sixteen cells reach 9.5 percent. The curve flattens beyond roughly sixteen to twenty-four cells. At the operating point, using the same underlying sample size as the split-half analysis, the audit costs 16 times 15, or 240 single-output-token queries, with about 16 thousand input tokens. That is not “free,” but it is small enough for repeated monitoring rather than one-off investigation.
The ecosystem findings are where the method becomes a measurement instrument rather than just a benchmark. The strongest identity anomaly concerns writer/palmyra-x5: its fingerprint lies at distance 0.141 from qwen/qwen3-235b-a22b-2507, which is at the median genuine same-model distance of 0.140 and far below the impostor range. The paper is careful to frame this as a distributional deviation, not an accusation of fraud, because benign explanations such as updated weights or sanctioned quantization are possible. Still, the measurement result is unusually crisp: a proprietary-branded flagship endpoint is distributionally indistinguishable from an open-weight Qwen deployment under this probe family.
The deployment anomaly results are equally important. Among 34 same-model provider pairs, ten diverge beyond the 5th percentile of impostor distances. The extreme case is meta-llama/llama-3.2-3b-instruct served by Cloudflare versus Parasail at distance 0.716. Even openai/gpt-4 served via Azure versus OpenAI first-party reaches 0.392. These numbers do not prove malicious substitution; they prove that the protocol detects distributional non-equivalence across serving paths. The paper also reports serving-layer opacity that content-blind audits would miss: flagship chat endpoints consuming about 40 to 60 completion tokens per visible one-word answer, 0.76 percent of responses carrying reasoning traces despite a disable flag, and 2,486 of 326,047 census responses excluded because they entered a separate reasoning-trace class.
Evidence Quality, Boundary Conditions, and Failure Modes
The evidence is stronger than a qualitative anomaly report because the paper includes pre-registration and pilot design criteria. The pilot over 14 models fixed thresholds for validity, greedy determinism, a permutation-tested inter-family versus intra-family divergence gap at , and cost extrapolation. This is rare in behavioral fingerprinting and improves confidence that the main run was not post-hoc fitted to a favorable subset. The release of raw responses with per-request serving metadata, timestamps, latencies, token usage, and cost further raises the evidential standard.
However, the most important limitations are structural rather than incidental. First, the protocol needs a trusted reference deployment for enrollment. If the verifier cannot enroll a genuine reference, the verification claim degrades into clustering or anomaly detection without an anchor. Second, the paper quantifies short-horizon stability but not multi-month drift; model updates, tokenizer changes, or serving-layer adjustments can require re-enrollment. Third, the method requires the direct one-token completion channel to be observable. Endpoints with mandatory hidden reasoning are excluded because the answer after a reasoning phase samples a different generative process. The paper also notes that some endpoints advertise reasoning as optional but ignore the disable flag, or expose no visible reasoning trace while consuming several times more completion tokens than the visible answer. Such cases are excluded rather than fingerprinted, which is methodologically conservative but also shows that the audit target is narrower than “any chat API.”
Fourth, the verification numbers rest on split-half genuine trials, where two disjoint halves of the same model’s samples are compared. Those trials are useful for estimating intrinsic noise, but they are not identical to the adversarial endpoint-versus-reference setting. The cross-provider test partially addresses this by yielding area under the curve 0.880 for verification against a reference collected at a different provider, but the gap versus 0.971 same-mix shows that serving stacks do affect fingerprints. Fifth, family labels depend on public documentation and are manually curated, so label noise likely depresses rather than inflates lineage accuracy. That cuts both ways: it makes the reported lineage results conservative, but it also means that “family” is not a fully objective biological category.
Finally, the paper’s robustness against adaptive filtering is argued more than experimentally exhausted. The open-ended paraphrase space is a good defense-in-depth design, but a dedicated paraphrase-invariance experiment is left to future work. A provider that detects “this is a distribution-collection request” might still alter responses if it has a good classifier of audit traffic. The author’s position is that the protocol raises the cost of undetected substitution rather than making substitution impossible. That is an honest forensic framing, and it is probably the right one for an API-auditing paper.
Deep Insights and Conclusion
The lasting contribution is a reframing of model identity as a distribution over tiny ordinary outputs. Instead of asking “what long text did the model generate?” the method asks “what one-word answers does it prefer under repeated trivial sampling?” This shifts the forensic problem from content matching to behavioral distribution matching. The result is cheaper, less sensitive to prompt engineering, and easier to interleave with ordinary traffic. It also provides a rare practical artifact: a reliability-versus-query-budget curve that tells an operator how many cells are needed to obtain a desired equal error rate.
For researchers and engineering teams, the implication is that low-cost continuous auditing is now plausible. The paper’s cost figure of $0.21 per model for the full census is not just an anecdote about budget; it is a design constraint met by the method. The anomaly findings show that the instrument can surface real operational questions: branded endpoints whose distributions collapse to open-weight relatives, provider pairs whose same-model deployments diverge into impostor territory, and hidden token overhead that content-only audits cannot see.
The work does not solve the model substitution problem in a provable sense. It does not detect a fully adversarial emulator, and it depends on the assumption that trivial one-token distributions are stable and model-specific. But it moves the field from “this model might be substituted” to “we can audit this endpoint with a known false-alarm and miss-rate for a known token budget.” That transition—from qualitative concern to calibrated forensic protocol—is the paper’s real value.