
Predicting the Pulse of B3: How Online News Shapes Brazilian Stock Sectors
Using Online Economic News to Predict Trends in Brazilian Stock Market Sectors
This paper presents a framework for predicting short-term trends in various sectors of the Brazilian stock exchange (BM&FBOVESPA) using online economic news and social media signals. By employing ensemble machine learning models such as Random Forest and Gradient Boosting, the authors achieve significant predictive accuracy, particularly in the Oil & Gas sector, outperforming random baselines and technical persistence models.
TL;DR
Can the "hype" around an economic news article predict where a stock sector is headed in the next 15 minutes? This research proves it can. By analyzing 15 years of Brazilian economic news and its social media footprint, researchers built models that achieve over 70% accuracy in predicting intra-day trends for the BM&FBOVESPA (B3), significantly outperforming traditional technical baselines.
Problem & Motivation: Beyond the IBOVESPA Index
Most investors look at the market as a monolith (e.g., the IBOVESPA index), but reality is more granular. A corruption scandal might tank the "Financial" and "Petroleum" sectors but leave "Health" or "Food" untouched.
The authors identified a critical gap: Prior work often ignored the "Echo Chamber" effect. It isn't just about whether a news item is positive or negative; it's about how much people talk about it. In an age of viral social media, a shared news link on Facebook or Twitter can trigger retail investor panic faster than a formal earnings report.
Methodology: The 15-Minute Critical Window
The core of the methodology lies in the synchronization of news data and market response.
- Feature Engineering: Instead of just using text, the authors extracted 31 features, including the number of shares on Facebook, Twitter, and LinkedIn, and the volume of reader comments.
- Sentiment Mapping: Since high-quality sentiment tools are predominantly English-focused, the authors used machine translation to leverage the VADER algorithm, calculating a "Polarity" score for each news cluster.
- The Time-Lag Model: The authors chose a 15-minute window. Why? Because market sensitivity analysis (see figure below) showed that the correlation between news and price movements peaks significantly at the 15-minute mark and dissipates as the window expands to an hour or a day.
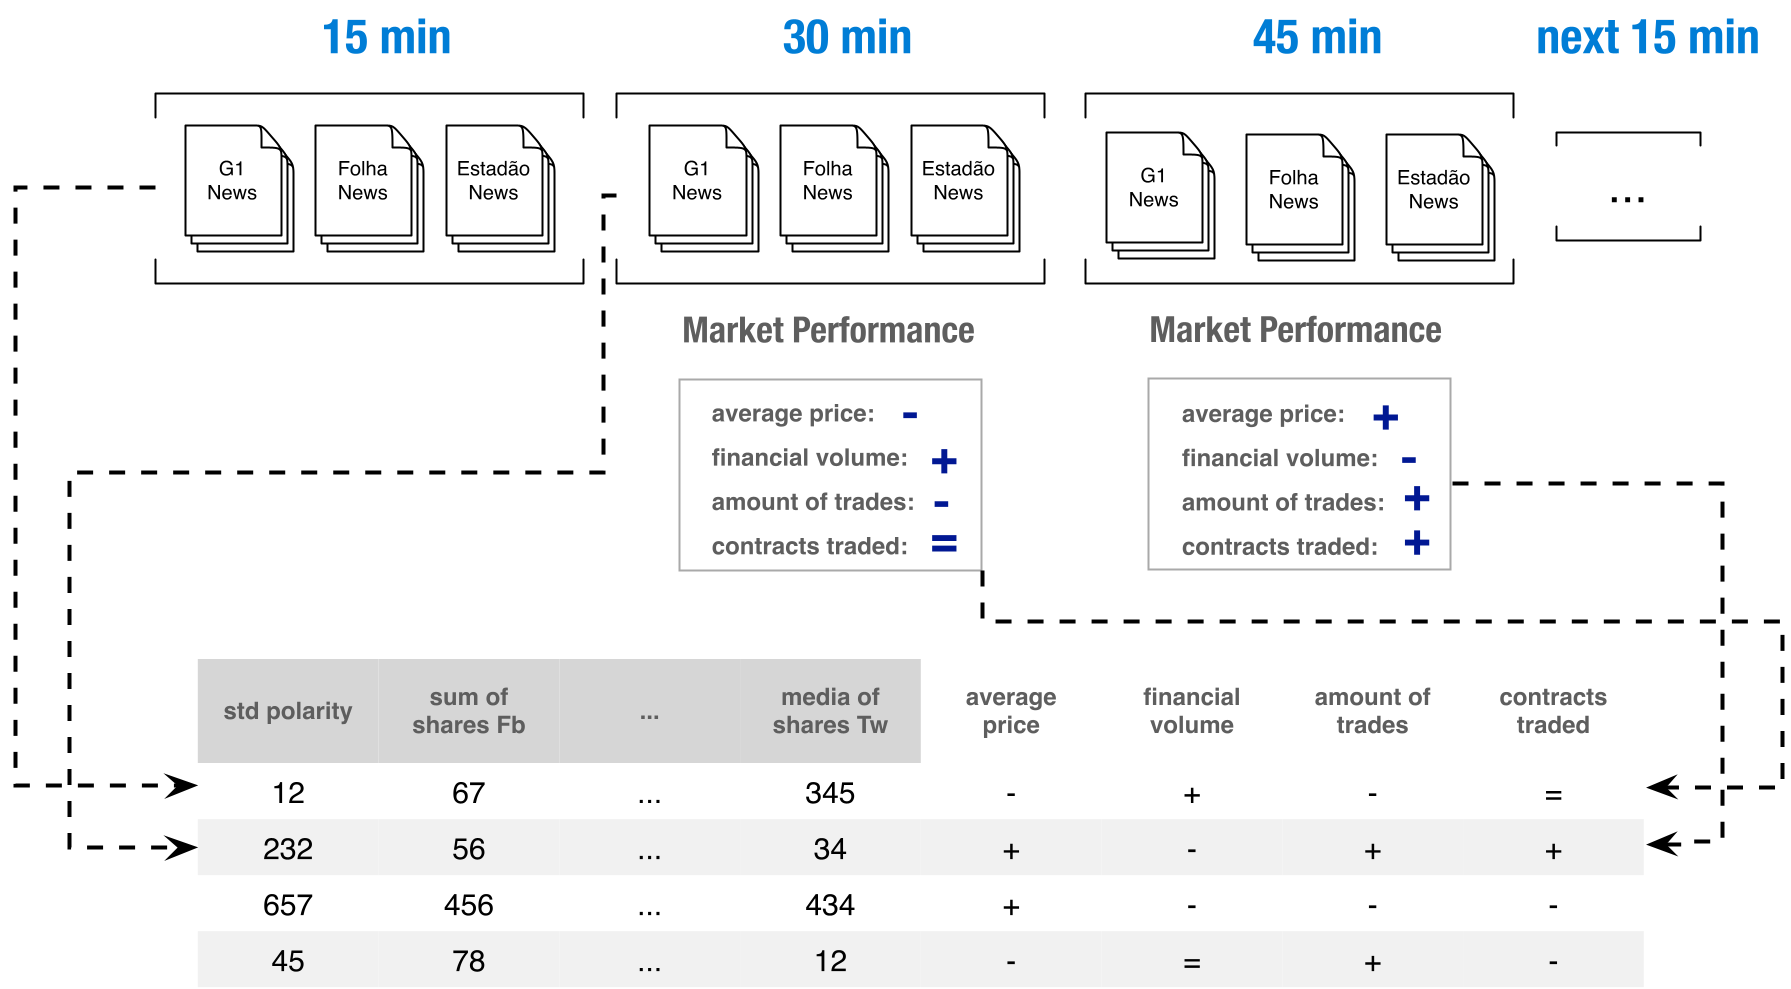 Figure: The data pipeline aggregates news features from Window T to predict market outcomes in Window T+1.
Experiments & Results: Negative News Travels Fast
The study reveals a fascinating asymmetry: Negative news generated twice as much repercussion as positive news. This correlates with the "Negative Bias" in psychology, where investors react more sharply to potential losses than gains.
Key Performance Highlights:
- Best Sector: Oil, Gas, and Biofuels was the most predictable. This is likely due to the massive influence of Petrobrás, a state-owned giant that dominates Brazilian headlines.
- Worst Sector: Industrial Goods showed the lowest predictability, suggesting its movements are driven more by long-term logistics and global trade than by localized intra-day news cycles.
- The "Volume Threshold": The researchers found a "tipping point" for accuracy. If a 15-minute window contains more than 19 news items, the model’s accuracy jumps from roughly 50% to over 70%.
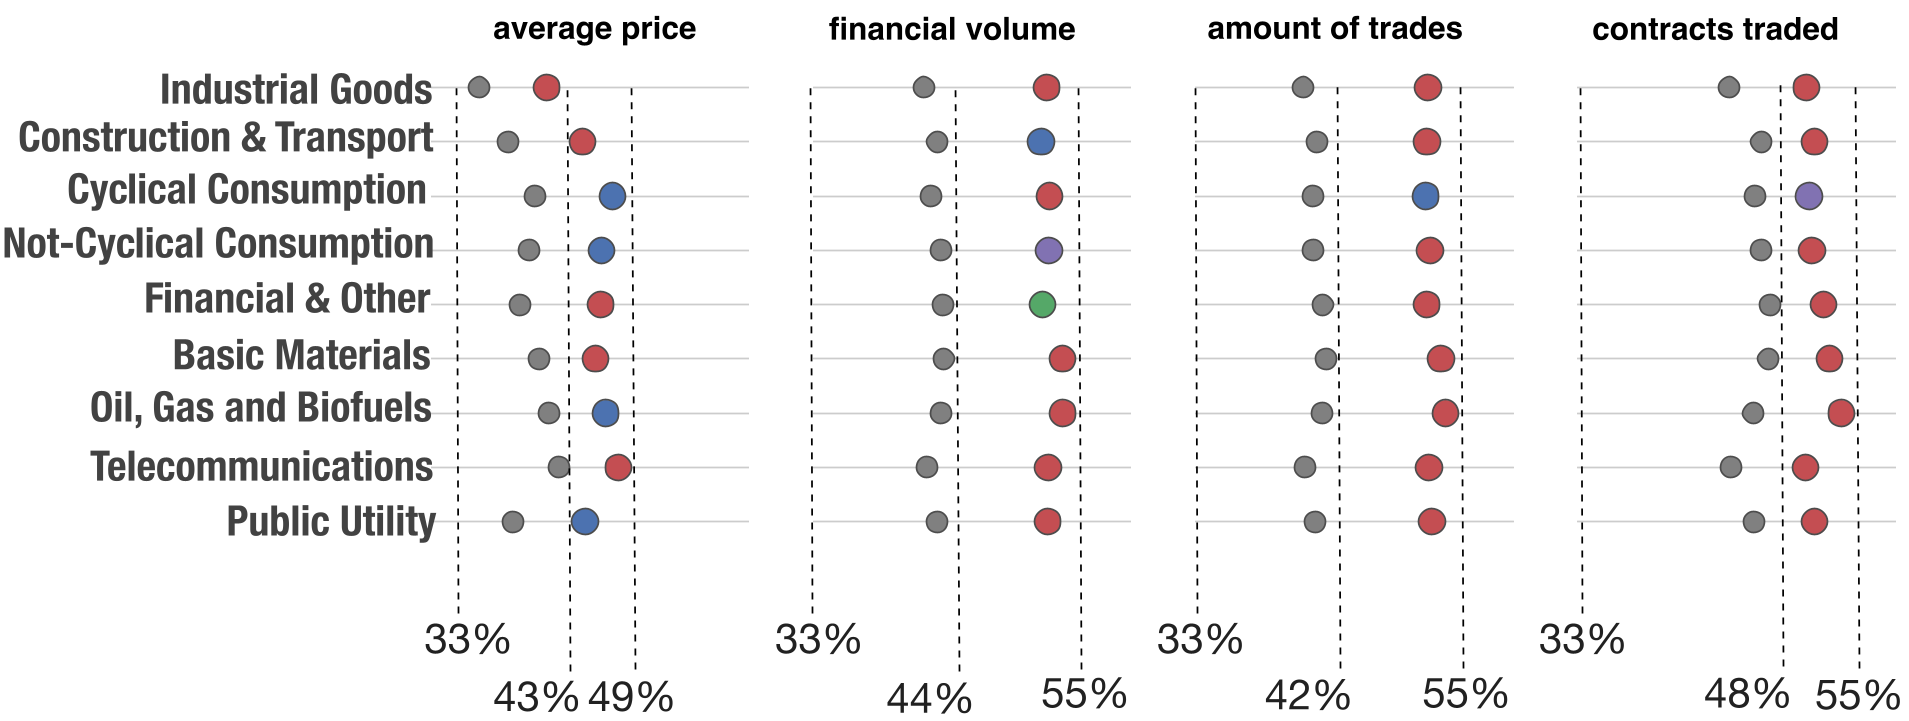 Figure: Comparison of various ML algorithms (Gradient Boosting, Random Forest) against the 'Random' and 'Keep Trend' baselines.
Depth Insight: The Twitter Signal
Interestingly, the "Information Gain" analysis (see figure below) showed that Twitter-related features were among the most influential predictors. Despite Facebook having more users, the real-time, fast-paced nature of Twitter makes it a more potent lead indicator for financial markets.
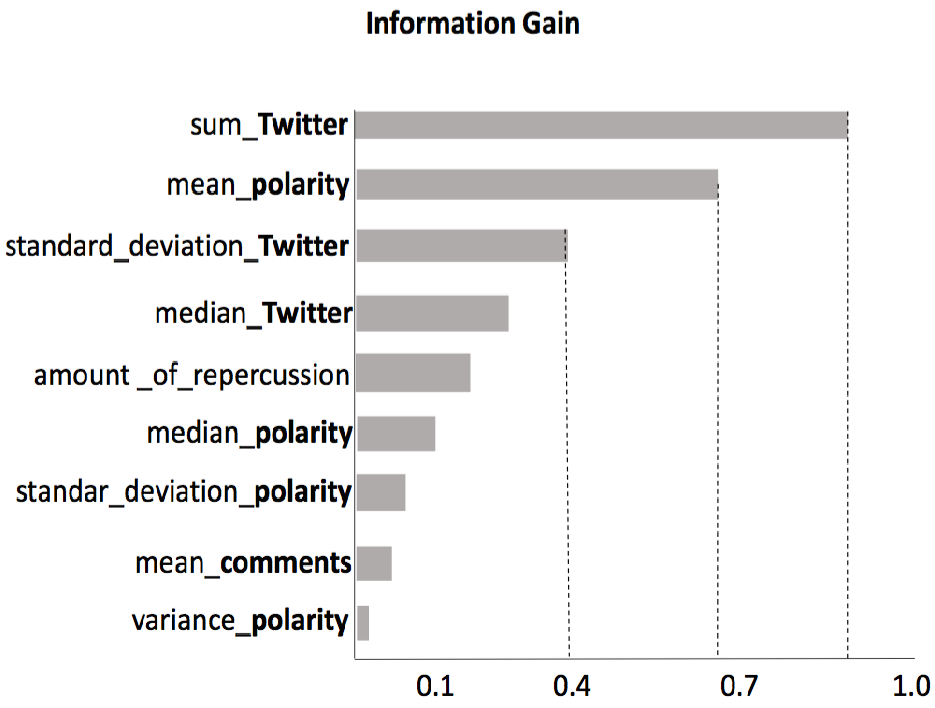 Figure: Twitter metrics consistently outperformed other social platforms in providing predictive signal.
Critical Analysis & Conclusion
This paper provides a robust proof-of-concept for Sector-Specific News Sensitivity. However, its reliance on machine translation for sentiment analysis is a double-edged sword; while it allows the use of Vader, it may miss nuanced Brazilian economic slang (e.g., terms like "Lava Jato" context).
Future Outlook: The methodology could be significantly enhanced by using Large Language Models (LLMs) like GPT-4 or specialized financial BERT models to analyze the text directly in Portuguese. Furthermore, incorporating "order book" data alongside news could create an even more powerful short-term arbitrage tool.
The takeaway for investors? Watch the share counts, not just the headlines. If a negative story about a state-owned sector starts trending on Twitter, you have a roughly 15-minute window before the full impact hits the B3 floor.