
Mapping the Consumer Mind: Using Ontology and Data Mining to Decode the Product Spectrum
Ontology-based data mining approach implemented on exploring product and brand spectrum
This paper proposes an Ontology-based Data Mining approach to visualize the beverage market in Taiwan through Product and Brand Spectrums. By integrating the Apriori algorithm and Two-step clustering, the study transforms raw consumer data into actionable knowledge maps for strategic marketing.
TL;DR
In the hyper-competitive beverage market, understanding what people buy is not enough; one must understand the spectrum of their preferences. This paper introduces an ontology-based data mining framework that segments consumers and maps their brand perceptions into a "spectrum." By combining clustering with the Apriori algorithm, the researchers provide a visual strategic tool for brand positioning and product development.
The "Spectrum" Metaphor: Beyond Discrete Values
In physics, a spectrum represents a continuous range of light frequencies. The authors argue that commerce operates similarly. Consumer preferences aren't binary; they exist in a continuum. However, managers often lack the tools to visualize where their brands sit relative to competitors within this continuum. The problem is twofold: customer knowledge is "concealed," and decentralized data is too massive to interpret without a structured conceptual framework.
Methodology: The Power of Ontology-Driven Mining
The core innovation lies in the use of Ontology to bridge the gap between raw data and human-interpretable knowledge. Before mining, the authors defined explicit conceptual structures for:
- Consumer Ontology: Demographics and lifestyles.
- Purchase Ontology: Motivations (thirst-quenching vs. social) and situations.
- Product Ontology: Ingredients, flavors, and categories.
The System Architecture
The workflow transforms questionnaire data into a relational database, which then feeds into a two-step mining process.
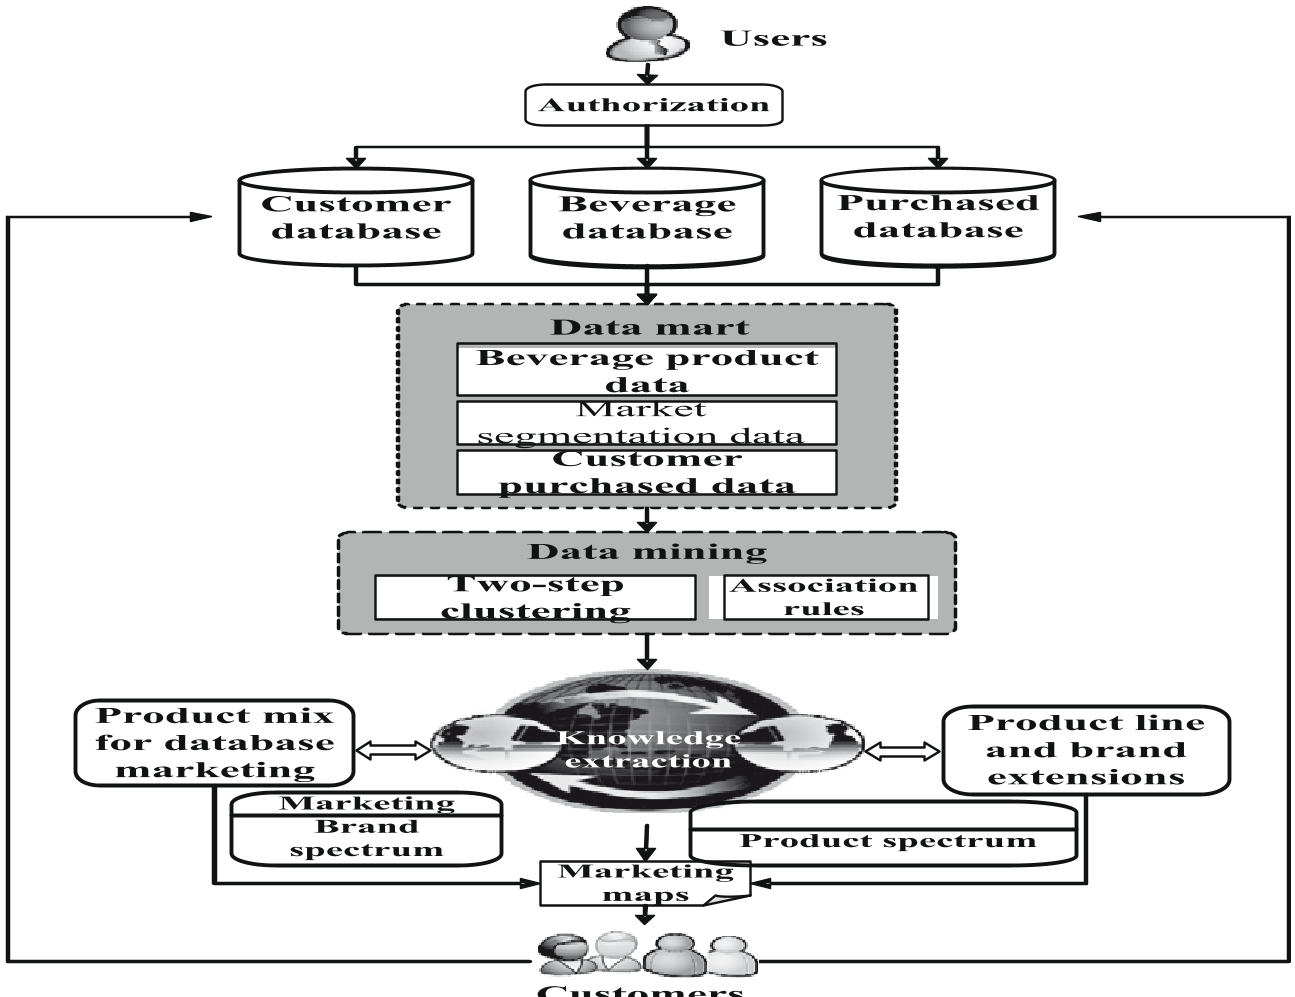 Figure 1: The physical database design and system flow.
- Clustering: Using a two-step algorithm to segment the market into Social Freshmen, Students, and Working Professionals.
- Association Rules (Apriori): Identifying hidden links. For instance, if a "Social Freshman" buys a Latte, there is an 87.9% confidence (Lift 1.29) they are also interested in Cappuccino or Green Tea.
Deep Dive: The Product and Brand Spectrum
The paper introduces two visual coordinates for strategy:
1. The Product Spectrum
This identifies the preference sequence. In the Taiwan beverage market, Tea Drinks dominate across all clusters, followed by Fruit Juices and Coffee. Interestingly, for students (Cluster-2), "Other Beverages" (Milk and Soy Milk) ranked higher due to healthy breakfast habits.
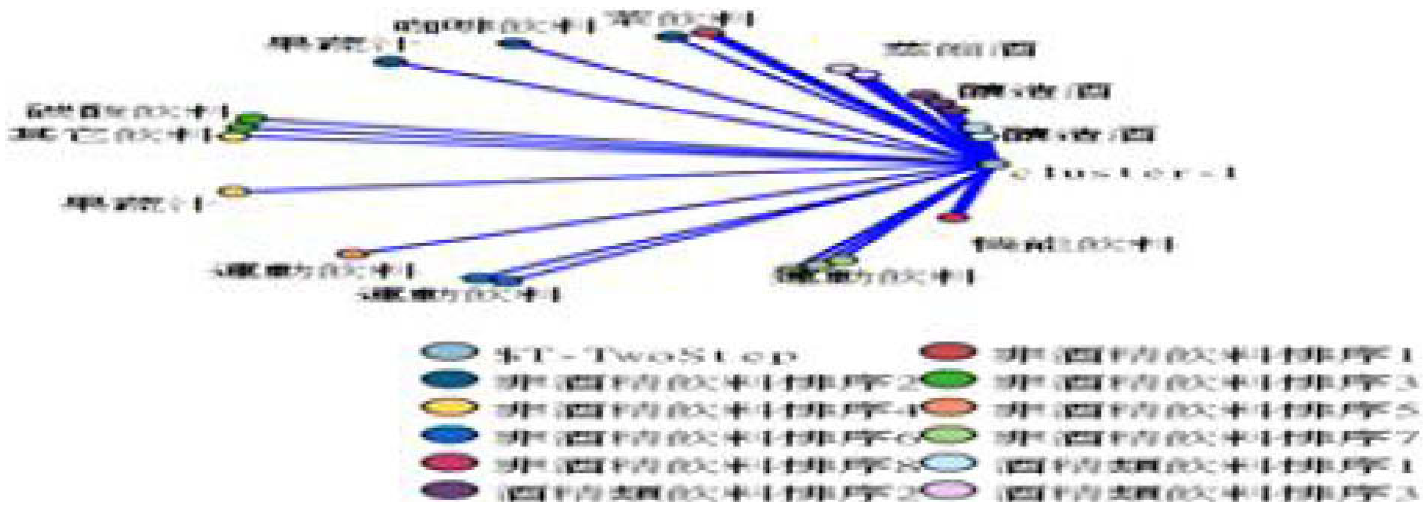 Figure 2: Understanding the complex relationships in product combinations.
2. The Brand Spectrum
Using beer as a case study, the authors mapped brand recall against "Advertising Perception" and "Mouthfeel." For Cluster-1 (Social Freshmen), Heineken led in advertising influence, while Taiwan Beer led in brand recall. This discrepancy shows that while big budgets buy awareness, local presence drives memory.
Strategic Insights: The Four-Quadrant Analysis
The researchers conclude with a powerful strategic matrix for managers:
- Quadrant I (Strong Preference / Powerful Brand): Maintain quality and brand image.
- Quadrant II (Strong Preference / Weak Brand): Increase "vivid" advertising to boost brand association.
- Quadrant III (Low Preference / Powerful Brand): Leverage the brand name to extend into new product categories.
- Quadrant IV (Low Preference / Weak Brand): Focus on niche segmentation or educate consumers on unique benefits.
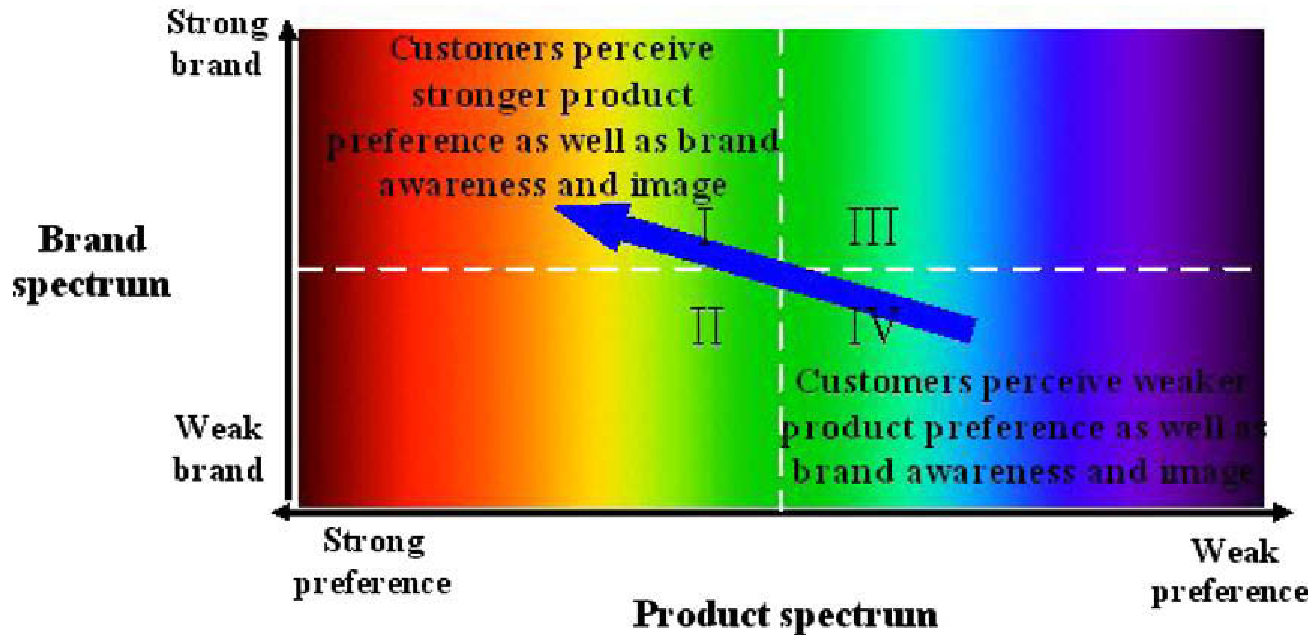 Figure 3: Proposed strategic matrix for brand and product positioning.
Critical Analysis & Conclusion
This study moves beyond simple sales tracking by incorporating Inductive Bias through ontologies. By defining the relationships before mining the data, the results are naturally aligned with business logic.
Limitations: The study relies on questionnaire data from Taiwan, which introduces self-reporting bias. Future work should integrate real-time POS (Point of Sale) data and explore if these spectrums shift across different cultural contexts or industries like consumer electronics.
Takeaway: Data mining is not just about numbers; it’s about mapping the "rainbow" in the consumer’s mind.