
Beyond Grades: Quantifying IT Competencies via Ontology-Based Student Models
An ontology-based IT student model in an educational social network
This paper introduces an ontology-based student model designed for SoNITS, an educational social network for IT students. The core method utilizes a light-weight IT skill taxonomy and a ten-degree "skill-meter" to quantitatively measure and infer student competencies using three specialized induction rules.
TL;DR
Transcripts alone rarely tell the whole story of a student's technical repertoire. This paper presents a specialized student model for the SoNITS social network that uses an IT-Skill Ontology to map course results into 214 distinct competencies. By using quantitative "skill-meters" and social-network integration, it transforms static grades into dynamic, visual professional profiles (Radar Charts) that students actually find accurate.
The "Disconnected Skill" Problem
Most educational systems view skills as isolated data points: "Student A passed C++." However, in the real world, skills are highly interconnected. If you are an expert in C++, you likely have an implicit understanding of Memory Management or Java, even if you haven't taken a specific course in them.
Prior works often used Descriptive Logic, which is excellent for classification but poor at handling the quantitative nuances of learning progress. The authors argue that a student's journey over four years requires a model that can "fill in the blanks" when direct evidence (like a course grade) is missing.
Methodology: The Skill-Meter and Induction Logic
The researchers built a light-weight ontology focusing on four pillars: IT Management, IT Problem Solving, IT Soft Skills, and Natural Science.
The Ten-Degree Scale
Instead of binary "Know/Don't Know," the system uses a 0-9 scale. This represents a journey from "No knowledge" (0) through "Applicable" (4) up to "Expert" (9).
Filling the Gaps with Induction Rules
The true innovation lies in how the model handles missing data. Since no student takes every possible course, the system uses three types of human-like reasoning to estimate skill levels:
- Sibling Induction: Based on dissimilarity values. If you are good at "C++ Programming," the system induces a similar score for "C#" because they share high similarity, but might induce a lower score for "Linux SysAdmin."
- Upward Induction: General skills (e.g., "Programming") are calculated as the average of their children nodes (e.g., Python, Java, Ruby).
- Downward Induction: If a student is marked as good at "Database Management," the system assumes proficiency in specific sub-skills like "SQL" until evidence proves otherwise.
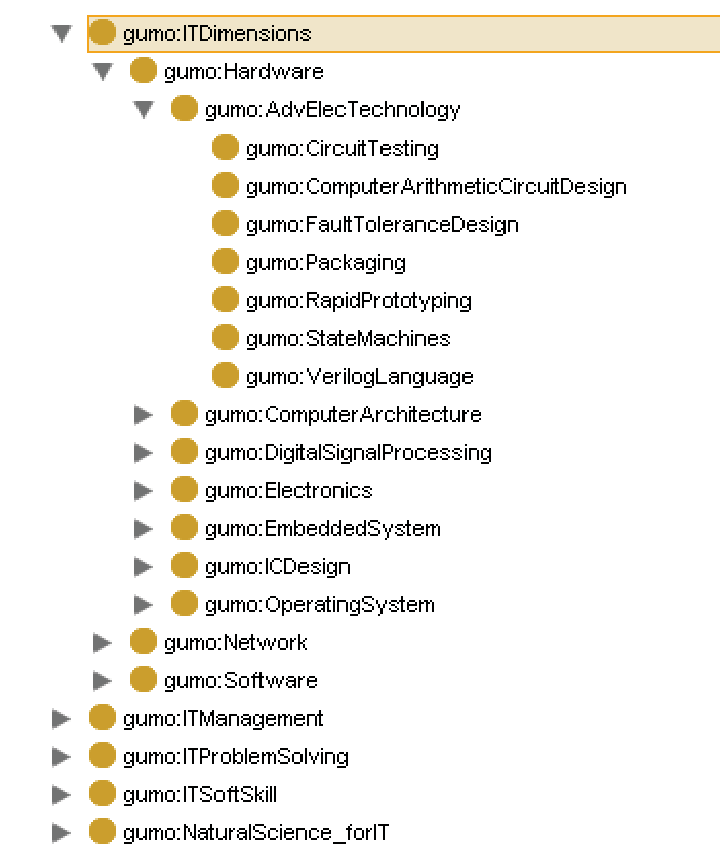 Figure 1: A segment of the IT-Skill Ontology showing the hierarchical relationship of technical terms.
Visualizing the Student "DNA"
To make these complex models "scrutable" (understandable/editable by the user), the paper introduces two primary views:
- The Tree-View: Allows students to drill down into why the system thinks they have a specific skill level (providing "Reasoning" links).
- The Radar-View: Provides a holistic "footprint" of the student's expertise in Software, Hardware, or Networking.
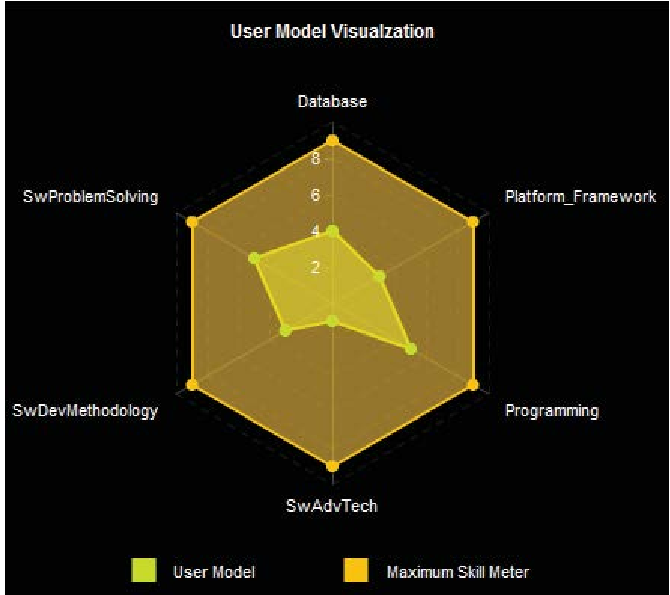 Figure 2: The Radar Chart gives students an immediate visual grasp of their major strengths and weaknesses.
Results and Student Perception
The system was tested on 36 third-year students. The results were overwhelmingly positive:
- 73.88% (Average Agreement): Students felt the generated charts accurately reflected their major and individual capabilities.
- Low Disagreement: Only ~4% felt the system was wrong.
- The "Undecided" Factor: About 22% of students remained neutral, which the authors attribute to the high information density of the charts—suggesting a need for simpler UX in the future.
Critical Insight & Future Outlook
While this 2011 paper predates the modern LLM-based talent matching era, its logic remains foundational. The use of Dissimilarity Values () in sibling induction is an early precursor to modern Embedding Distance in vector spaces.
The main limitation is the manual curation of the 214 IT terms. In today's landscape, a dynamic ontology that crawls GitHub or StackOverflow would be necessary to keep up with the rapid pace of tech. However, the core takeaway is clear: Educational social networks should move beyond transcripts to represent students as a multi-dimensional "web" of evolving skills.