
The $p^*$ Revolution: Breaking the Independence Barrier in Social Network Analysis
A p U primer: logit models for social networks
This paper presents the family of statistical models for social networks, a significant breakthrough that utilizes Markov Random Fields and autologistic regression to model complex dependencies in relational data. The authors extend this framework from single networks to multiple networks, allowing for the simultaneous analysis of structural similarities and differences across groups using standard logistic regression software.
TL;DR
This landmark paper by Anderson, Wasserman, and Crouch introduces a primer and extension for the family of models (now widely known as ERGMs). By leveraging Markov Random Fields, it allows researchers to model complex network dependencies—like "a friend of my friend is my friend"—without the restrictive "independence" assumptions of the past. It also provides a robust methodology for comparing multiple social groups (e.g., different classrooms) within a single statistical framework.
Background: Beyond the Dyadic Island
For decades, social network analysis was hamstrung by a major simplification: the assumption that relationships (ties) were independent. In reality, human social structures are defined by interdependence. If Alice is friends with Bob, and Bob is friends with Charlie, there is a high "triadic" probability that Alice will also be friends with Charlie.
The authors position this work as a bridge, taking the "Markov Graph" theories of Frank and Strauss (1986) and turning them into a practical, "standardized" tool for behavioral scientists.
The Problem: The Curse of the Normalizing Constant
The core mathematical challenge in modeling a whole network is the function . To calculate the true probability of a specific network configuration, you theoretically need to compare it against every possible network of that size. For a group of only 20 people, the number of possible directed graphs is , a number so large it defies computation.
Methodology: The Autologistic Insight
The "magic" of the model lies in its transition to conditional odds. Instead of looking at the whole network at once, we look at the probability of a single tie appearing, conditioned on the rest of the network ():
Here, is the difference statistic. It represents how much the "structure" (like the number of triangles or mutual pairs) would change if the tie were added versus if it were absent.
Key Model Parameters
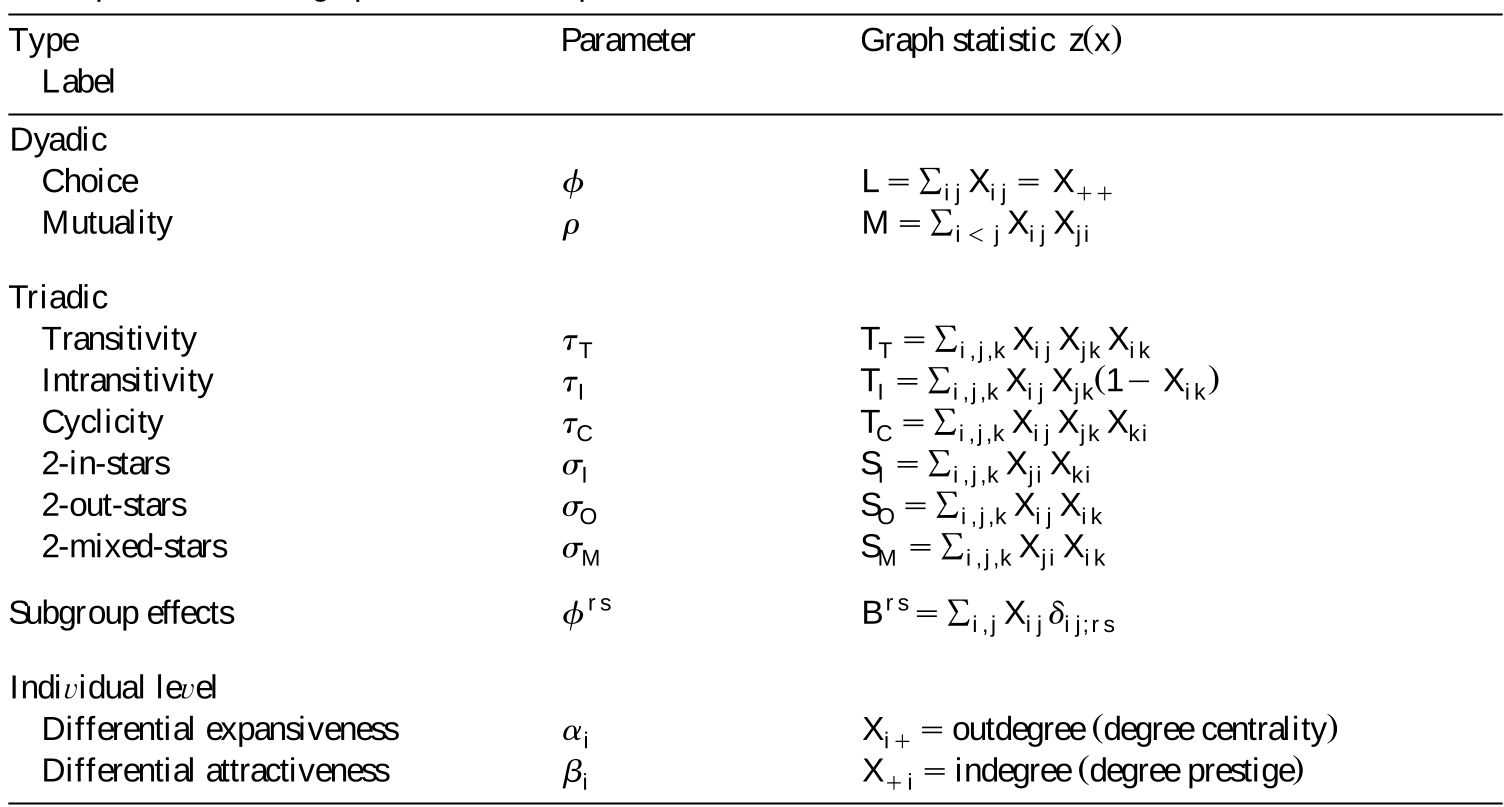
The paper categorizes social drivers into:
- Dyadic Effects: Choice (density) and Mutuality (reciprocaity).
- Triadic Effects: Transitivity (triangles) and Cyclicity.
- Subgroup/Attribute Effects: Tendencies for same-gender or same-age actors to link.
Experiments: Friendship in the Classroom
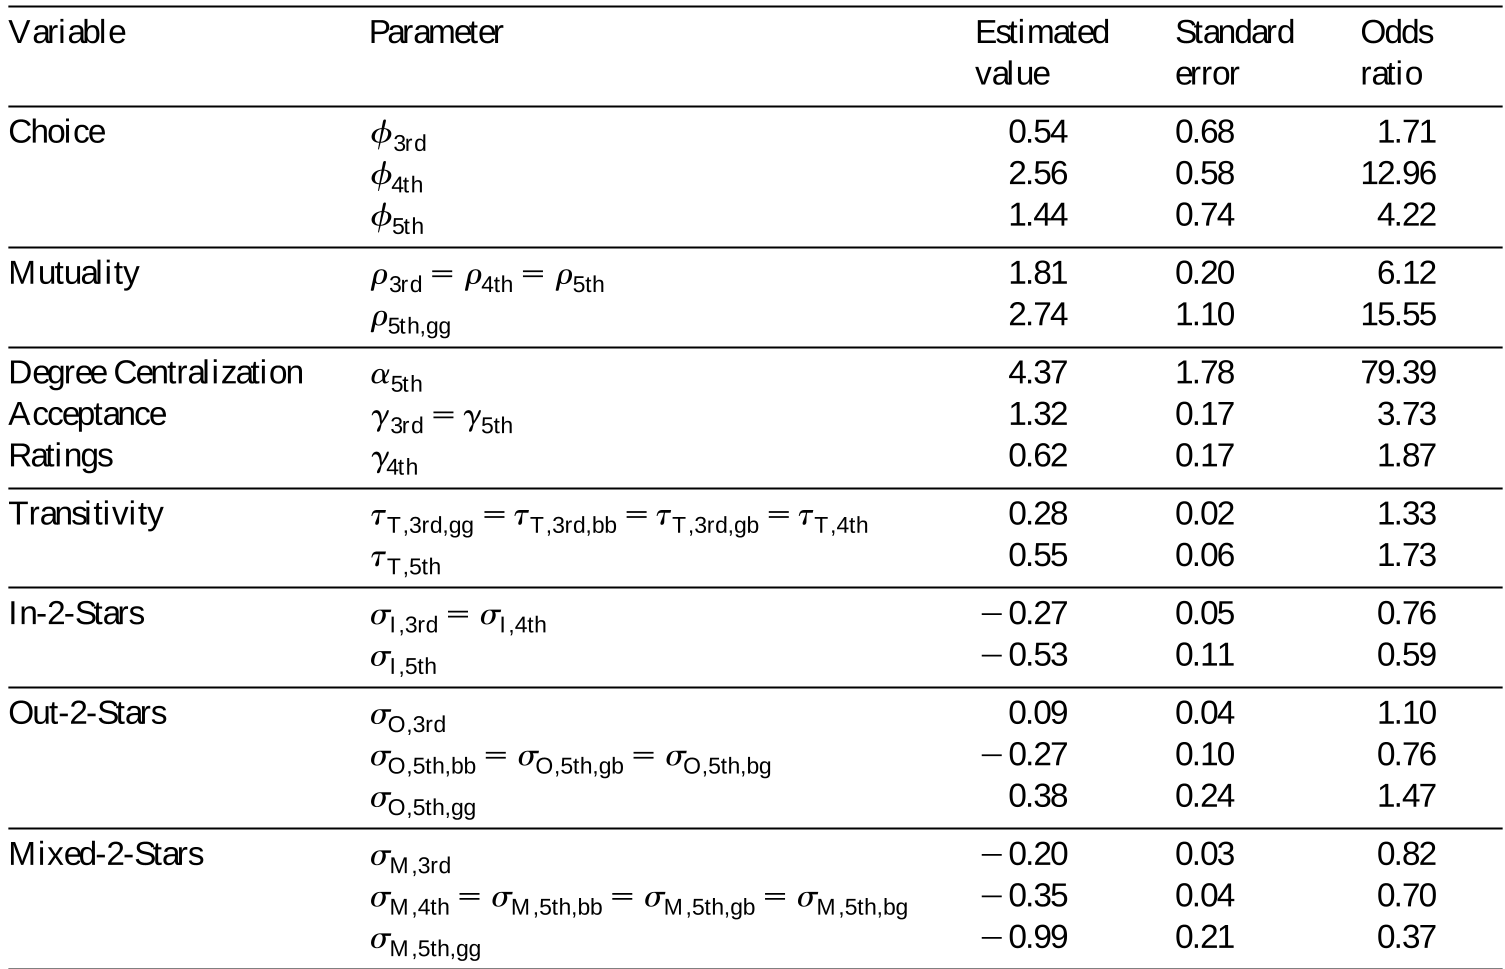
The authors applied this to a dataset of friendship nominations among 3rd, 4th, and 5th graders.
1. Gender Homophily
In the 4th-grade class, the "Choice" parameter for same-gender pairs () was significantly higher than for different-gender pairs (). The odds ratio shows that a child is 6.75 times more likely to nominate a friend of the same gender.
2. The Power of Mutuality
Across all grades, mutuality was the strongest predictor. If Child A chooses Child B, the odds that Child B also chooses Child A increase by a factor of 26.3 in the 4th-grade model.
3. Cross-Grade Comparison
By extending to multiple networks, the authors found that while 3rd and 4th graders showed similar friendship patterns, the 5th-grade class exhibited much higher "Degree Centralization"—meaning a small group of "popular" children received a disproportionate number of nominations.
Critical Insight & Conclusion
The true value of this paper isn't just in the school-data results; it is in the democratization of network modeling. By showing that models can be fit using Pseudo-Likelihood and standard logistic regression packages (like SAS or SPSS), the authors moved complex network science out of the realm of pure mathematics and into the hands of psychologists, sociologists, and political scientists.
Limitations
- Pseudo-likelihood Bias: While computationally efficient, MPLE can sometimes produce biased estimates or fail to converge in highly "degenerate" networks where the model over-predicts total connectivity.
- Static nature: These models describe a snapshot in time, rather than the evolution of a network.
Takeaway: If you want to understand why a social structure looks the way it does, stop looking at individuals in isolation. Look at the configurations (stars, triangles, reciprocations) they form. is the lens that makes this visible.