
From Ink to Interaction: Digitizing the Sociogram for High-Risk Populations
Evaluating the Paper-to-Screen Translation of Participant-Aided Sociograms with High-Risk Participants
This paper introduces netCanvas, an open-source digital framework designed to translate analog "participant-aided sociograms" (PAS) into a touch-optimized, interactive experience. Primarily tested with young men who have sex with men (YMSM), the system achieves state-of-the-art (SOTA) efficiency in capturing complex, sensitive social and sexual network data.
Executive Summary
TL;DR: Researchers from Oxford and Northwestern have successfully digitized the "pen-and-paper" method of drawing social networks. Their tool, netCanvas, uses a touch-first interface to capture complex sexual and social networks faster than analog methods without sacrificing the "human" tactile feel that encourages disclosure in sensitive populations.
In the landscape of Social Network Analysis (SNA), this work represents a critical methodological evolution. It bridges the gap between high-tech "Big Data" (which often misses hidden behaviors) and low-tech "Small Data" (which is agonizingly slow to process).
The Motivation: Why Trace Data Isn't Enough
While we live in an era of "digital traces" where Facebook likes and email logs can map much of our social lives, sensitive health behaviors—such as drug use or sexual practices—remain largely invisible to passive data collection. For epidemiologists and health researchers working with high-risk groups like YMSM (young men who have sex with men), self-report is the only way to get the full picture.
However, traditional network surveys are a nightmare for both parties:
- The Respondent: Faced with a "dyadic census" (e.g., "Does friend A know friend B?"), a network of just 20 people requires answering 190 repetitive questions.
- The Researcher: Transforming a hand-drawn sociogram (paper with lines and post-it notes) into a digital database usually requires 2–3 hours of manual data entry per participant.
Methodology: The netCanvas Design Philosophy
The authors realized that for a digital tool to work in the field, it had to mimic the tactile intuition of physical objects.
1. The "Object" Metaphor
In netCanvas, people are not just names in a list; they are "cards" or "nodes" that can be touched, dragged, and grouped. This maintains the spatial reasoning humans naturally use when thinking about their social circles.
2. Multi-Stage Protocol (netCanvas-R)
The team decomposed the interview into distinct, manageable stages:
- Name Generation: Eliciting the names of network members.
- Name Interpretation: Assigning attributes (age, race, identity) via "binning" (dragging cards into categories).
- Edge Generation: Drawing ties between people simply by tapping them sequentially.
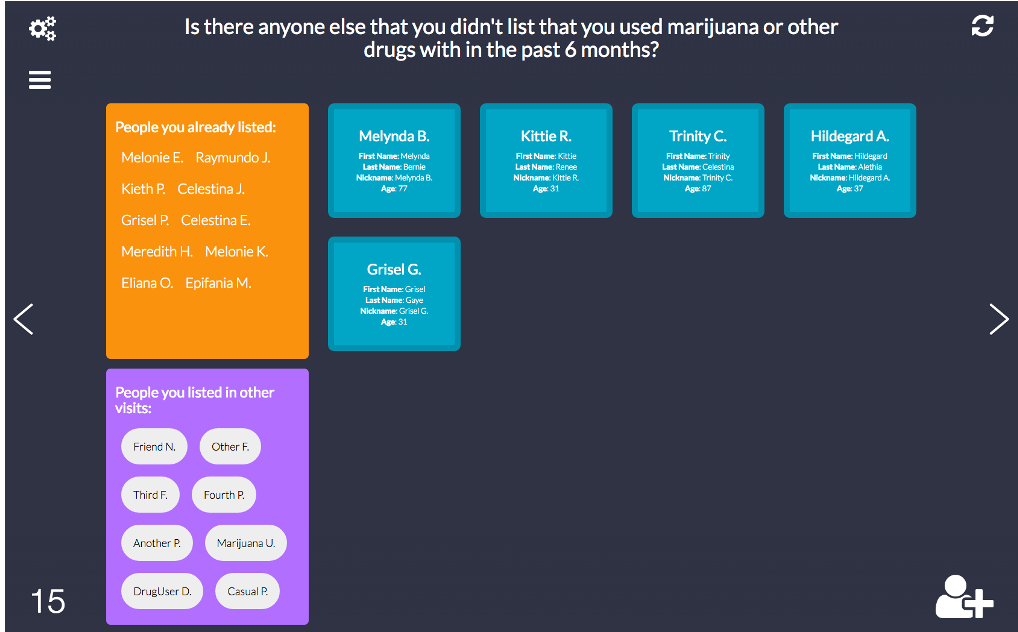 Figure: The Name Generator interface—minimalist, card-based, and focused on reducing cognitive load.
3. Smart Skip Logic
Unlike static surveys, netCanvas uses the underlying graph database to perform real-time queries. If a participant identifies a group of sex partners, the system can automatically trigger specific follow-up questions for those nodes only, significantly shortening the interview.
Experimental Results: Faster, Better, Friendlier
The researchers conducted a "natural experiment" by comparing data from an older study (LYNC, using paper) and a new one (RADAR, using netCanvas) within the same cohort.
The Efficiency Leap
The most striking finding was the time saved. netCanvas-R took a median of 32 minutes, while the analog version took 47 minutes. That’s a roughly 33% reduction in respondent burden. Furthermore, the data was immediately ready for analysis, eliminating the "lab-side" bottleneck of manual coding.
Data Fidelity
Crucially, the digital transition didn't "scare off" sensitive information. Participants reported equivalent numbers of sex and drug partners and similar frequencies of high-risk behaviors across both platforms.
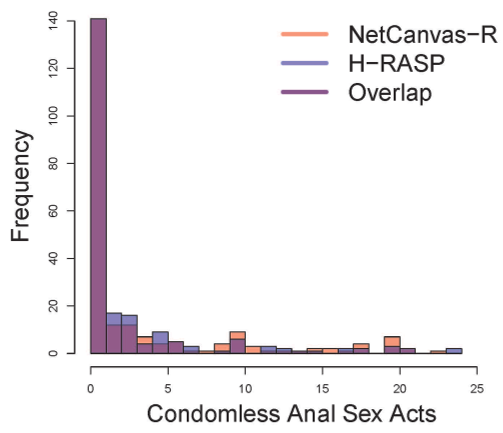 Figure: Comparison of behavioral disclosure between the digital tool and existing self-report measures, showing high correlation and data consistency.
Critical Insights: Simplicity is Science
The success of netCanvas lies in its HCI-first approach. While previous digital tools focused on the "expert" researcher (filling the screen with complex menus), netCanvas focuses on the "novice" participant. By keeping the interface clean and "fun"—using descriptive words like "Interactive" and "Simple"—the researchers turned a dry data-collection task into an engaging process.
Limitations: The authors admit that the tool currently requires a high level of technical skill (HTML5/JS) to set up. However, the move toward a "survey-building wizard" suggests that democratizing this technology is on the horizon.
Conclusion
The old aphorism was to "keep high technology in the lab and low technology in the field." This paper effectively rewrites that rule: "Keep complexity in the lab and simplicity in the field." By leveraging the power of touchscreens and graph logic, netCanvas proves that we can collect high-fidelity, complex social data without exhausting our participants.
For those interested in building their own protocols, the netCanvas framework is open-source and adaptable for diverse sociological and epidemiological research tasks.