
Parkinson’s Detection: Why the Brainstem is the Hidden Key to Early Diagnosis
Parkinson’s Disease Detection from fMRI-Derived Brainstem Regional Functional Connectivity Networks
2020-01-01
Summary
Problem
Method
Results
Takeaways
Abstract
This paper introduces a novel data-driven framework for Parkinson's Disease (PD) detection using functional MRI (fMRI) focused specifically on brainstem regional connectivity. By optimizing a weighted modularity community function and employing an SVM classifier, the method achieves a high sensitivity of 94% using only nine graph-theoretic features.
## Executive Summary
**TL;DR**: Researchers at the University of British Columbia have pivoted away from complex whole-brain analysis to focus on the **brainstem**—the ground zero of Parkinson’s Disease (PD). By developing a data-driven framework to partition the brainstem into 84 functional sub-regions, they achieved a staggering **94% sensitivity** in disease detection using simple machine learning and only **9 topological features**.
**Context**: This study moves PD diagnostics from "broad-brush" whole-brain scans to a "precision-targeted" approach, proving that the earliest pathological changes in the brainstem contain enough signal to outperform much larger cortical datasets.
## The Motivation: Why Look at the Brainstem?
Most existing literature on PD imaging focuses on the cortex or basal ganglia. While these areas are affected, the **Braak Staging** hypothesis suggests that the pathology actually begins in the brainstem (specifically the medulla and pons) before ascending to the rest of the brain.
The problem? The brainstem is notoriously hard to segment. Its structures are small, and anatomical templates often fail to capture functional variations. Prior works require whole-brain connectivity (~150+ features) to reach high accuracy, leading to potential overfitting and high computational costs.
## Methodology: Mapping the "Unmappable"
The researchers' pipeline consists of two distinct phases:
### 1. Group Model Generation
Using healthy control data, they treated the brainstem as a network of voxels. They applied a **Weighted-Modularity** community detection algorithm to group voxels with similar BOLD (Blood Oxygen Level Dependent) signal patterns. Through **Consensus Clustering**, they established a stable map of 84 functional sub-regions.
### 2. Connectivity Modeling
Once the regions were defined, they modeled how these 84 nodes "talk" to each other using two methods:
* **PCfdr**: A conditional independence algorithm that controls the False Discovery Rate.
* **SICov**: A Sparse Inverse Covariance method using LASSO to find the most efficient network paths.
## Performance and Insights
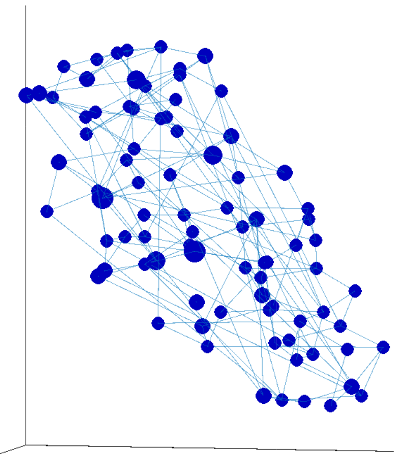
The study extracted 9 graph-theoretic features, including **Clustering Coefficient**, **Global Efficiency**, and the **Fiedler Value** (a measure of network "connectedness").
### Key Results:
* **Sensitivity**: 94% (Only one patient was misclassified).
* **Severity Correlation**: The SVM classifier's "PD Likelihood" score increased linearly with the **Hoehn and Yahr (H&Y)** score, moving from 0.56 (mild) to 0.77 (moderate).
* **Efficiency**: Achieved SOTA results with only 9 features, whereas previous cortical-based studies required 150+.
| Model Type | Sensitivity | Specificity | Accuracy |
| :--- | :--- | :--- | :--- |
| **PCfdr-based** | **94%** | 71% | 82% |
| **SICov-based** | 82% | 82% | 82% |
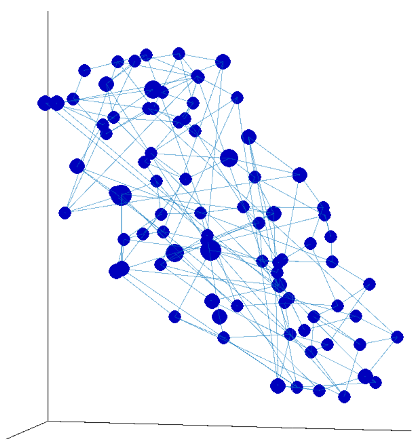
*Fig: Visualization demonstrating the stark difference in regional connectivity between a Healthy Control (left) and PD Patient (right).*
## Critical Analysis & The Path Ahead
**Why did this work?** The brainstem is the bottleneck of neural signals. By focusing on it, the researchers reduced "noise" from unaffected cortical regions during early stages. The use of PCfdr was particularly effective as it pruned insignificant connections, leaving behind a "skeleton" of the disease's impact on network topology.
**Limitations**: The study utilized a relatively small dataset (n=34). While the results are promising, validation on larger, multi-site longitudinal cohorts is necessary to see if these 84 sub-regions remain stable across different populations.
**Future Work**: The authors plan to integrate these brainstem sub-regions back into a whole-brain model, looking at the "output" integrity of the brainstem to the rest of the cortex. This could lead to a multi-stage diagnostic tool that tracks PD from its origin to its eventual spread.
### Conclusion
This research confirms that in the case of Parkinson's, **smaller is better**. By zooming into the brainstem and using data-driven functional partitioning, we can detect PD with high sensitivity, potentially years before clinical motor symptoms become irreversible.