
Who Really Pulls the Strings? A Network Science View of Participatory Policy
What drives participatory policy processes: Grassroot activities, scientific knowledge or donor money? – A comparative policy network approach
This study develops a policy network approach using Exponential Random Graph Models (ERGM) to quantify political influence in the participatory policy processes of Ghana, Senegal, and Uganda. It distinguishes between two primary influence mechanisms—vote-buying and informational lobbying—revealing that while CAADP aims for broad participation, the landscape is actually dominated by international donors and research organizations.
TL;DR
Is "stakeholder participation" in developing nations a democratic breakthrough or just a high-brow metaphor for elite control? This paper uses sophisticated Exponential Random Graph Models (ERGM) to map the power networks in Ghana, Senegal, and Uganda. The verdict: International donors and research bodies dominate, while the "grassroots" (farmers and civil society) are largely sidelined.
Context: The Participation Paradox
In development circles, "participation" is the ultimate buzzword. The theory is simple: involve local stakeholders, and you get better, more sustainable policy. Yet, in practice, disillusionment is rampant. Marginalized groups feel left out, and governments often treat participation as a checkbox exercise.
The authors of this study identify a critical gap: we talk about participation constantly but rarely quantify political influence. They ask a provocative question: What drives these networks—grassroots activity, scientific knowledge, or donor money?
Methodology: Mapping the Invisible
To answer this, the researchers focused on the Comprehensive African Agricultural Development Plan (CAADP). They didn't just look at who was in the room (formal committees); they looked at two distinct "influence flows":
- Vote-Buying (Political Support): Trading political favors for support from a constituency.
- Informational Lobbying: Gaining influence by strategically providing technical expertise that politicians lack.
The ERGM Advantage
The study uses ERGM (Exponential Random Graph Models) to understand the network-generating process. This allows them to see if a tie between two organizations exists because of:
- Reciprocity: "I talk to you because you talk to me."
- Transitivity: "A friend of a friend is a contact."
- Multiplexity: "We trade support and information."
Key Insights: Where Does the Power Go?
1. The Dominance of "The Big Two"
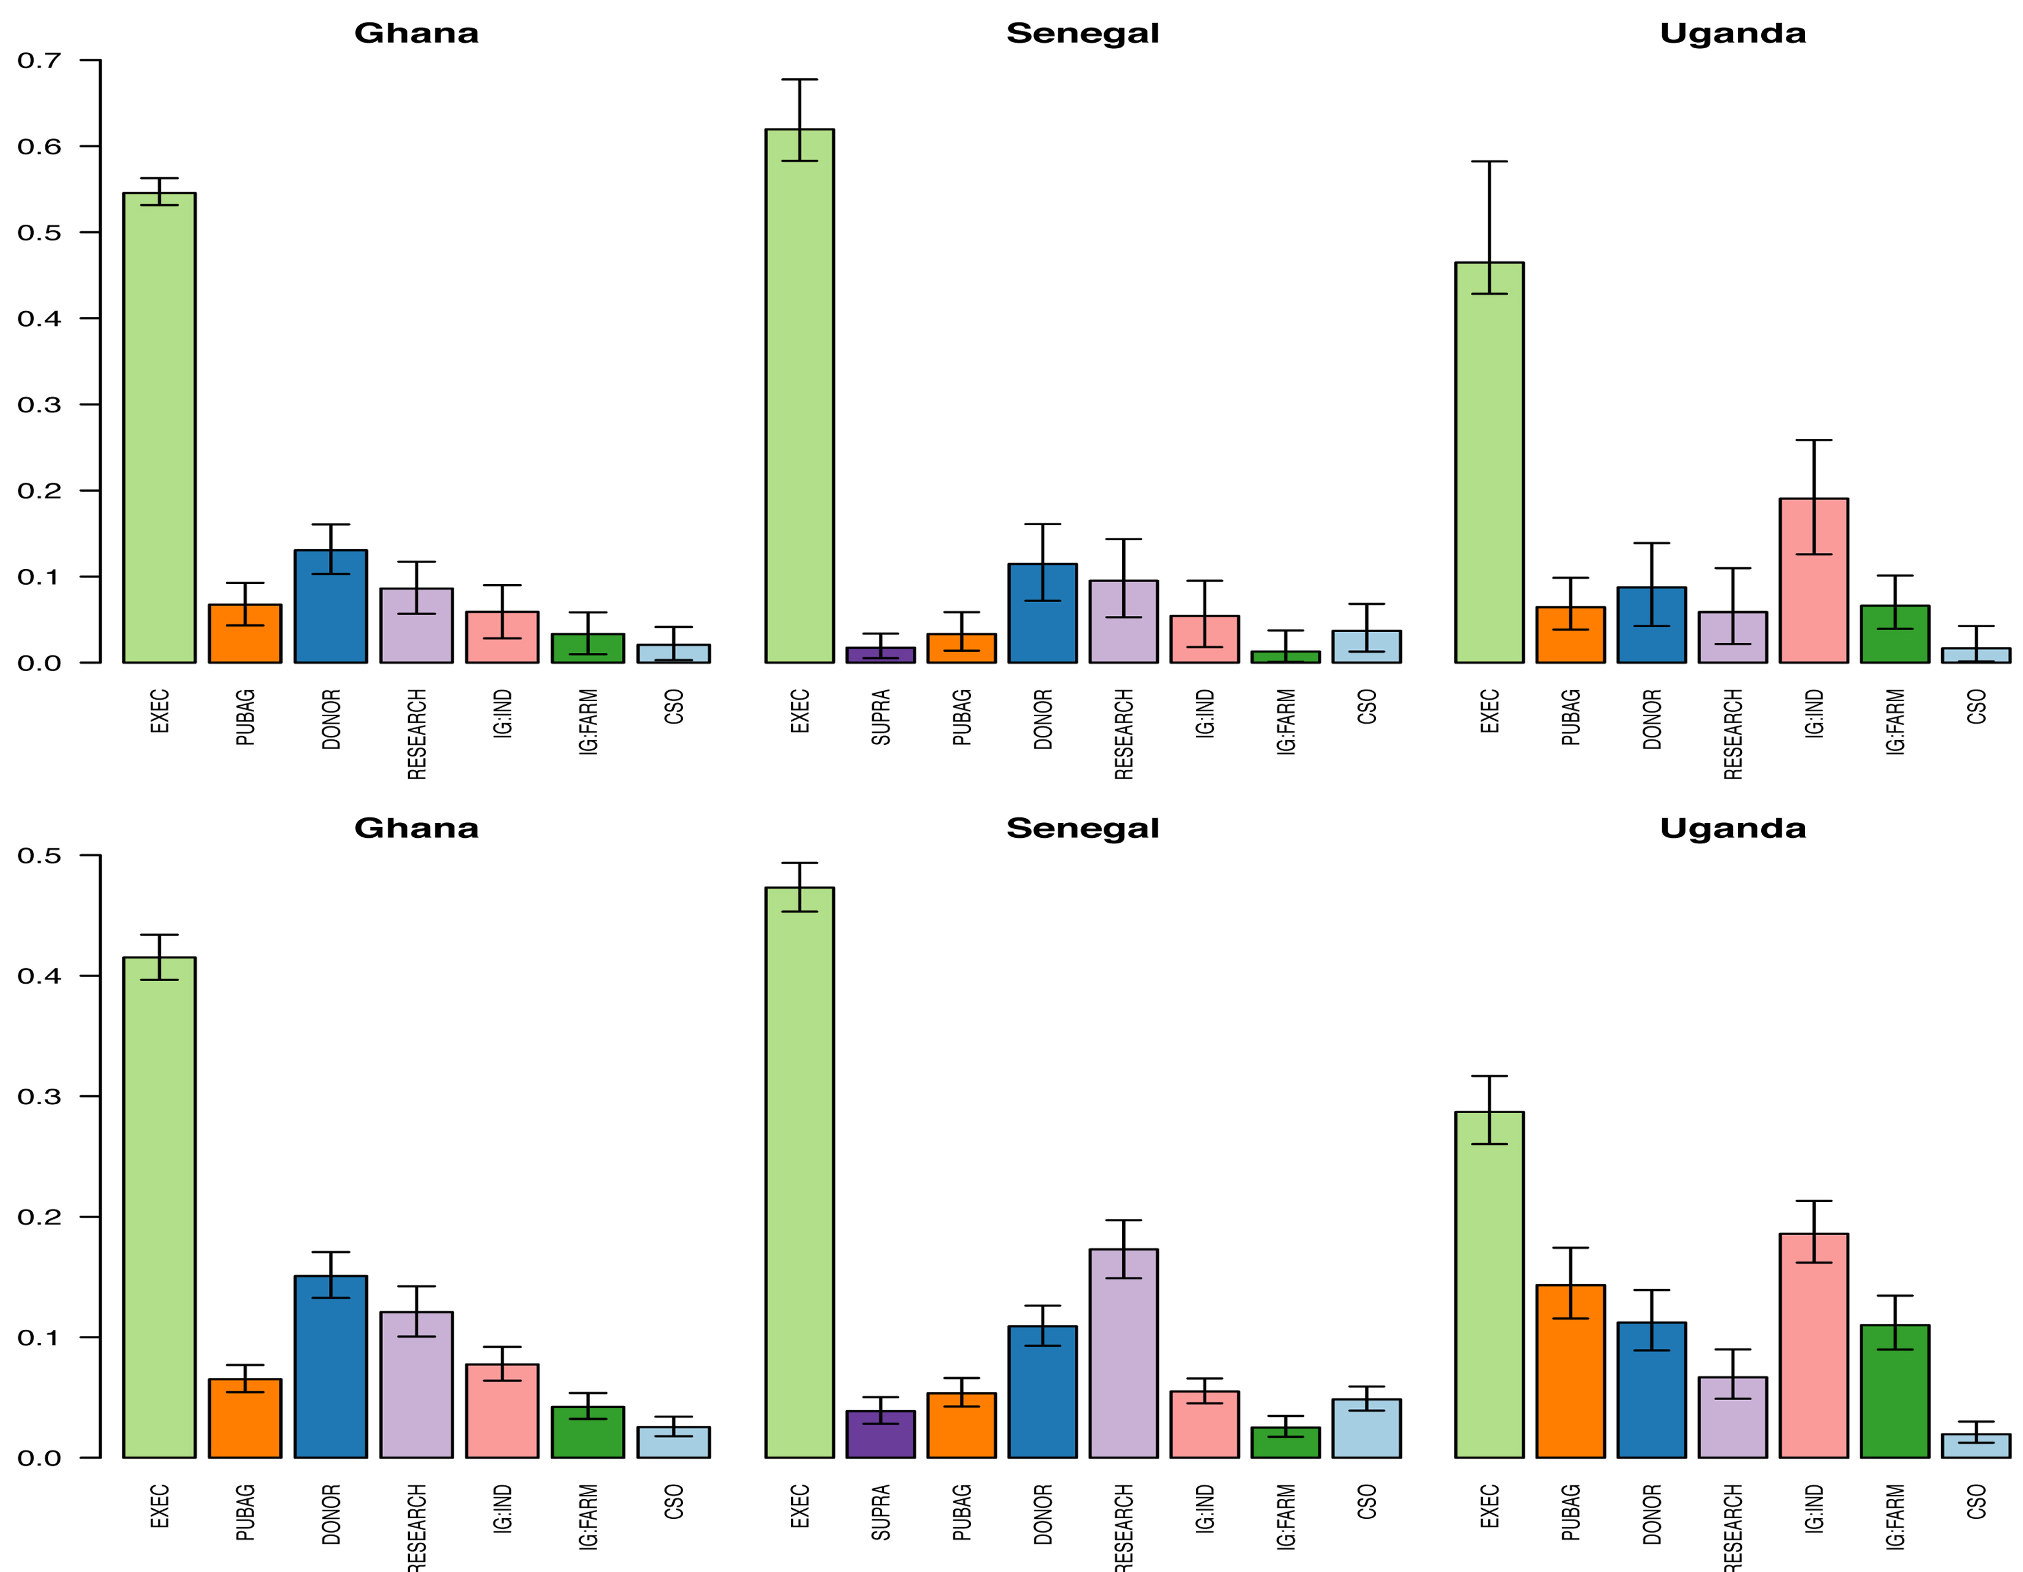
The analysis reveals three distinct tiers of influence. The "High-Influence Block" is consistently comprised of International Donors (World Bank, USAID, FAO) and Research Organizations. Donors don't just provide money; they are structurally equivalent to powerful government agents, often acting as the primary experts that smaller organizations rely on.
2. The Evidence-Based Success (and Failure)
In Senegal and Ghana, research organizations (like ISRA and ISSER) occupy a massive "informational lobbying" space. This suggests that the push for Evidence-Based Policy is working. However, in Uganda, the network looks more like an "old patronage" system, where the government is mostly advised by its own subordinate agencies rather than independent experts.
3. The Institutional Blind Spot
Perhaps the most striking finding for policy designers: Formal committee membership (MEMBER) was mostly insignificant. Being "at the table" did not automatically translate into being a key player in the information or support networks. Real power was driven by Social Embeddedness—the informal, relational networking that happens outside the boardroom.
Deep Dive: Relational vs. Institutional Factors
The study proves that transaction costs are the silent killers of grassroots participation. Organizations seek out partners they can trust (indicated by high reciprocity and transitivity in the models). Because marginalized groups (small farmers, rural poor) have lower "social networking capacity" and less technical expertise to trade, they are effectively priced out of the political marketplace.
The "Donor Money" Myth?
Interestingly, donor money (the "vote-buying" side) was less of a driver in Uganda than in Ghana. In Uganda, non-farm industrial interests actually held more sway over the government than agricultural interests, highlighting a "pro-urban bias" even in agricultural policy.
Critical Perspective: Can We Design Better Networks?
The authors conclude on a sober note: Designing optimal participatory networks is incredibly hard.
- Limits of Design: Since power is relational and reputation-based, you can't just "appoint" a farmer to a committee and expect them to have influence.
- Knowledge as Power: For the poor to have a voice, they need more than a seat; they need the technical capacity to engage in informational lobbying.
Conclusion
This paper moves the needle from "participation as a metaphor" to "participation as a measurable network structure." It highlights that in the CAADP process, while scientific knowledge is being heard, it is usually filtered through the lens of those who have the social capital to be heard—primarily donors and elite researchers. For future policy, the message is clear: focus less on the meeting list and more on the capacity to network.
Source Context: Henning et al. (2018/2026 update), What drives participatory policy processes: Grassroot activities, scientific knowledge or donor money?