
Twisted Growth: Deciphering the Co-Evolution of Users and Content in Social Networks
Patterns and modeling of group growth in online social networks
2014-12-01
Summary
Problem
Method
Results
Takeaways
Abstract
This paper investigates group growth patterns in online social networks using a dataset of two million users from the Douban Network. The authors propose the "Twisted Growth" (TG) model, an empirical framework that captures the reciprocal relationship between user acquisition and content generation, achieving high predictive accuracy for future group states.
## TL;DR
How do online communities explode in popularity and then sustain themselves? This study analyzes 2 million users on the Douban Network to reveal that group growth isn't just a linear progression—it's a "twisted" feedback loop. The researchers propose the **Twisted Growth (TG)** model, which proves that content attracts users, and those users create the very content that attracts the next wave, following distinct power-law and exponential patterns.
## The Core Intuition: The Content-User Feedback Loop
Most social network models look at either how messages spread or how many members join. However, this paper argues that these two are "twisted" together. The authors observed that:
1. **Attraction**: Old content acts as a magnet for new members.
2. **Creation**: New members possess high initial energy, generating the majority of their replies on their very first day (the "Passer" vs. "Regular" user distinction).
### Why Traditional Models Fail
Standard time-series analyses (like AR or LDS) often miss the non-linear "spark" that happens during a group's infancy. The authors found that in the early stages, both user and content growth follow an **exponential pattern**, which eventually settles into a more volatile, oscillatory stage.
## Methodology: The Twisted Growth (TG) Model
The TG model is built on two primary pillars: **User Growth** and **Content Growth**.
### 1. Modeling User Growth (The Attraction Factor)
By applying linear regression, the authors discovered a strong positive correlation between the number of new users ($G_u$) and the amount of content ($G_c$) created in preceding intervals. The equation $G_u(n+1) = k_n \cdot G_c(n) + b_n$ suggests that the "attractiveness" of a group is a measurable coefficient ($k_n$) that stabilizes over short periods.
### 2. Modeling Content Growth (The Interaction Factor)
A non-linear relationship exists here: $G_c(n) = A_n \cdot G_u(n)^{I_n} + O_n$.
- **$A_n$ (Active Factor)**: Represents the baseline productivity of the users.
- **$I_n$ (Interaction Factor)**: Reflects how much users interact with each other. This follows a logic similar to Metcalfe’s Law, where the potential interactions increase quadratically with the number of participants.
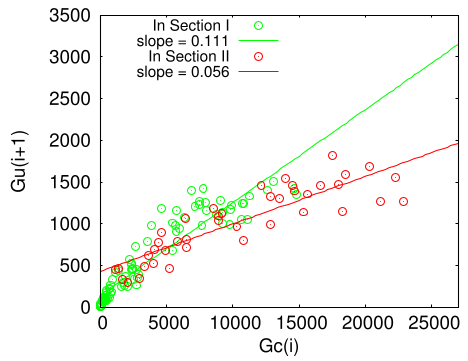
*Figure: The reciprocal framework where current content generates future users, who then generate future content.*
## Empirical Observations
The study produced several fascinating "Rules of Thumb" for social communities:
- **The One-Year Rule**: User activity frequency follows a power-law distribution that stays relatively stable for about one year before dropping off sharply.
- **The Heavy Tail of Longevity**: While most posts die young, a small fraction of "heavy-tail" posts remain active for a very long time, serving as the group's "evergreen" anchors.
- **The First-Day Peak**: Interactions are highest on a user’s first day. About 35% of first-day contributors are "passers" who never post again.
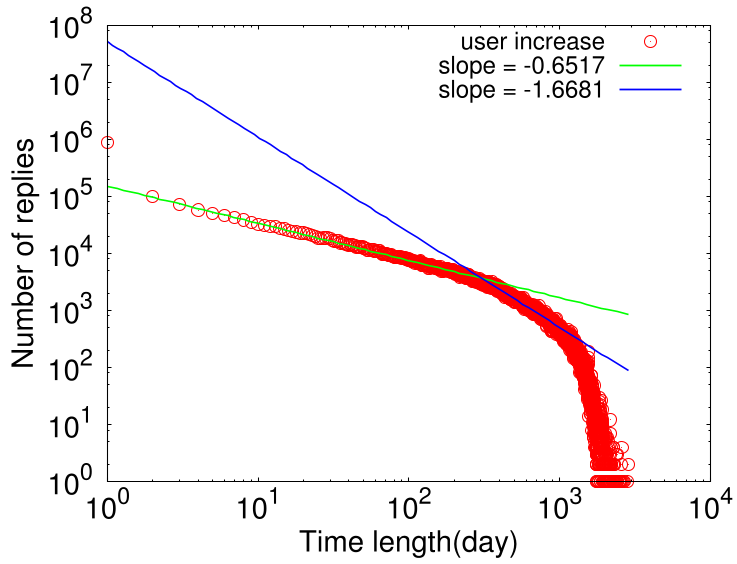
*Figure: The two-stage power-law distribution of user activity over time.*
## Experimental Results
The researchers validated their TG model across six distinct Douban groups (ranging from "classic literature" to "travel guides").
| Group Name | User Prediction Accuracy (n+1) | Content Prediction Accuracy (n+1) |
| :--- | :--- | :--- |
| postgraduates | 91.3% | 86.8% |
| travelguide | 86.4% | 81.5% |
| classicreading| 86.2% | 83.7% |
The model maintained high accuracy even when predicting two steps into the future, proving that the coefficients $k_n$, $A_n$, and $I_n$ are robust indicators of a community's health.
## Critical Analysis & Future Outlook
**Key Takeaway**: Growth is not accidental. By monitoring the interaction factor ($I_n$) and the attraction coefficient ($k_n$), platform moderators can predict when a group is entering its "oscillatory" phase or when it is at risk of stagnation.
**Limitations**: The model currently struggles with the "transition point"—the exact moment when a rising pattern flips into a falling pattern of information diffusion. The "why" behind the sudden decline of a thriving group remains a complex sociological mystery.
**Future Work**: Future iterations of TG could incorporate sentiment analysis or external cultural "shocks" to better explain the dramatic oscillations seen in mature groups. For community builders, the lesson is clear: Focus on the initial content quality to hook the "passers" and turn them into "regulars" before the one-year decay sets in.