
Roads That Kill: How Pavement Performance Dictates Traffic Safety
Assessing the Influence of Pavement Performance on Road Safety Through Crash Frequency and Severity Analysis
This study investigates the correlation between pavement performance (IRI, friction, rutting) and road safety using 2022 Iowa DOT data. By integrating crash and pavement inventory datasets, the authors employed Negative Binomial and Ordered Probit regression alongside Random Forest models to quantify how road conditions influence crash frequency and severity.
TL;DR
Is a smooth road always a safe road? Not necessarily. This deep dive into Iowa's 2022 transportation data reveals a complex reality: while rougher roads (high IRI) inevitably lead to more crashes, superior pavement friction and higher speed limits—often found on well-designed freeways—actually correlate with lower crash rates. However, when things go wrong at high speeds, the severity of the outcome spikes significantly.
Background Positioning
In the hierarchy of road safety, human behavior often takes center stage. However, this study shifts the focus back to the Roadway/Environmental pillar. Positioned as a data-driven empirical analysis, this work bridges the gap between traditional econometric modeling (Inference) and modern Machine Learning (Prediction) to provide a holistic view of infrastructure safety.
The "Safety-Friction" Paradox
The study tackles a critical friction point in civil engineering: the counterintuitive relationship between road quality and driver behavior. For instance, why does shallow rutting sometimes correlate with higher crash severity? The authors suggest a behavioral "Risk Homeostasis"—drivers tend to be more cautious on visibly "bad" roads, effectively lowering the risk through reduced speed, whereas "good" roads encourage higher velocities and less attentiveness.
Methodology: The Dual-Model Approach
The authors don't just rely on standard averages. They use a two-pronged mathematical attack:
- Negative Binomial Regression: Perfect for "count data" like crash frequency where the variance exceeds the mean (overdispersion).
- Ordered Probit Regression: Used to categorize severity on a 1-5 scale (from property damage to fatal).
Architecture of Analysis
The crucial step was the Spatial Join, buffering road segments into zones to associate specific IRI and Friction scores with pinpoint GPS crash coordinates.
 Figure: The process of merging crash points with buffered road segments for geographical context.
Key Insights from the Data
1. The Roughness Factor (IRI)
Rougher roads (Higher International Roughness Index) are a clear catalyst for accidents. The study used the Tukey HSD test to confirm that the increase in crash rates from "Good" to "Poor" IRI categories is statistically significant across almost all collision types.
2. The Speed Limit Conundrum
Perhaps the most surprising finding: Higher speed limits correlate with lower crash rates.
- Why? It’s not that speed is safe; it’s that high-speed roads (Interstates) are engineered to a much higher standard (limited access, no intersections, better medians).
- The Quantitative Edge: Every 1 mph increase in the posted limit corresponds to a 1.7% reduction in expected crash frequency, provided the infrastructure matches the speed.
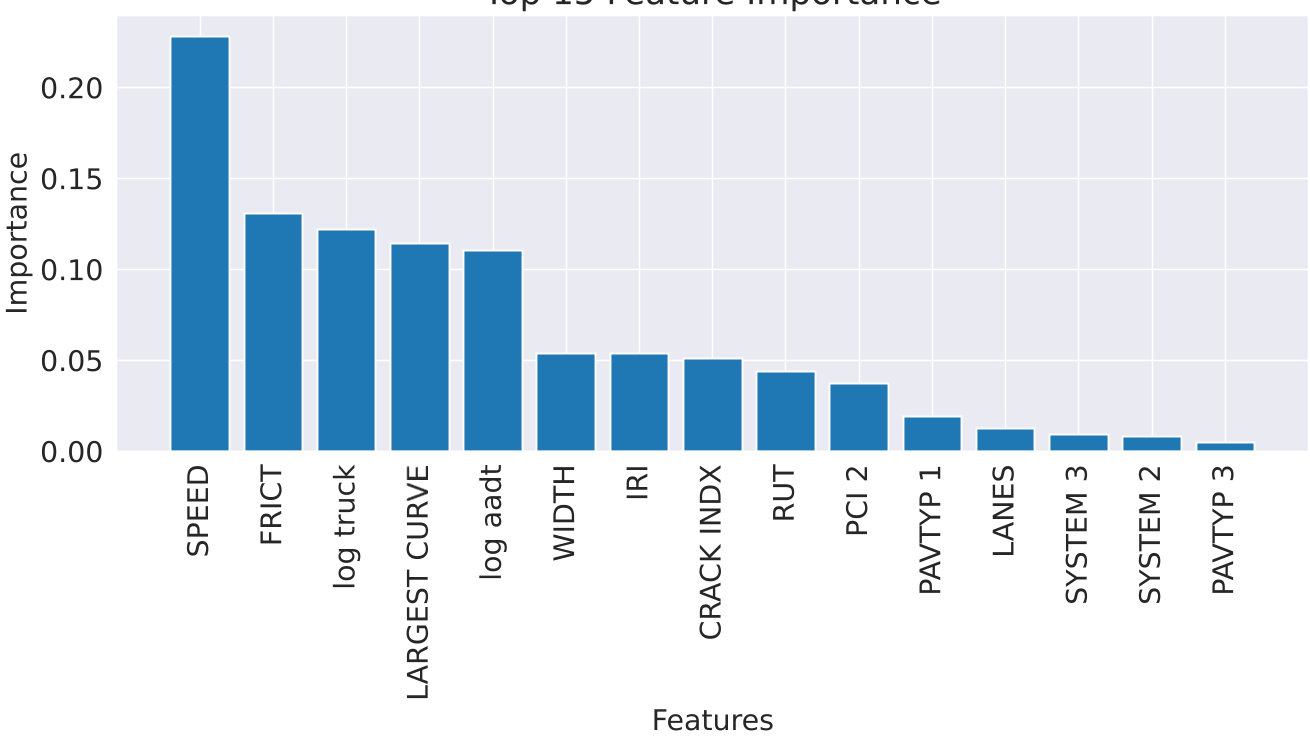 Figure: Random Forest analysis identifying Speed, Friction, and AADT as the primary drivers of crash frequency.
3. Friction and Severity
In the medium-speed range, higher friction (FRICT) actually showed a positive correlation with crash severity. This suggests that while better grip prevents skidding (reducing frequency), it may embolden drivers to take riskier maneuvers, resulting in higher-impact collisions.
Critical Analysis & Conclusion
Takeaways for Infrastructure Policy
- Maintenance Priority: Focus IRI and Friction improvements on "medium-speed" rural and urban collectors where the safety gains are most sensitive.
- Design Matters: The negative correlation between speed limits and crash rates proves that controlled access and geometric design are more effective safety tools than simply lowering speed limits on poorly maintained roads.
Limitations
The study is localized to Iowa. The "Friction vs. Severity" trend might vary in mountainous regions or areas with extreme tropical rainfall. Furthermore, the "Not Reported" weather data remains a significant noise factor in the Probit models.
Future Outlook
The next frontier is integrating Real-time Pavement Sensing. As vehicles become "sensors on wheels," the ability to map dynamic friction levels during rain or snow events will allow for variable speed limits that respond to the exact state of the pavement in real-time.