
SpeedPerception: Why Your Performance Metrics Are Lying to You
17180_Perceived Performance of Top Retail Webpages In the Wild Insights from Large-scale Crowdsourcing of Above-the-Fold QoE.
The paper introduces SpeedPerception, a large-scale crowdsourcing framework designed to quantify how humans perceive the "speed" of retail webpages. By analyzing 40,000+ user votes, the authors propose Perceptual SpeedIndex (PSI) and a modified measurement called SpeedIndex_TTC, achieving an 87% accuracy in predicting human QoE, significantly outperforming traditional W3C metrics.
TL;DR
Industry-standard metrics like onLoad and TTFB are remarkably poor at predicting whether a human finds a website "fast." This paper introduces a crowdsourced framework and the Perceptual SpeedIndex (PSI), proving that human speed perception is best captured by visual metrics integrated up to a specific "decision point" (Time to Click), achieving nearly 90% predictive accuracy.
The "Speed" Paradox: Metrics vs. Reality
For years, web developers have lived and died by the onLoad event. The assumption was simple: a faster load time equals a better user experience (QoE). However, in the era of dynamic third-party scripts, carousels, and "Above-the-Fold" (ATF) lazy loading, a page might feel ready long before the browser triggers the load event—or it might feel broken due to visual jitter even if the data arrived quickly.
The authors of this paper identified a critical gap: we are optimizing for browser events rather than human brains. To solve this, they built SpeedPerception, a framework to collect massive-scale human feedback on which of two pages actually "feels" faster.
Methodology: The A/B Human Benchmark
The researchers selected 160 pairs of videos from the Internet Retailer Top 500 (IR-500) websites. Users were shown these videos side-by-side and asked to pick the winner.
The Introduction of PSI
While Google’s SpeedIndex (SI) uses pixel-histogram differences to measure completeness, it is blind to "visual jitter"—layout shifts that annoy users. The authors proposed Perceptual SpeedIndex (PSI), which uses Structural Similarity (SSIM) to measure visual progress.
The "TTC" Insights
The most profound discovery was Time to Click (TTC). Most users don't wait for a page to be 100% "Visual Complete" (VC). They decide which page is faster somewhere between the first content paint and the final load.
 Figure 1: The SpeedPerception UI allows parallel comparison of ATF loading processes.
Key Results: Traditional Metrics Fail
The data was damning for traditional performance KPIs:
- onLoad: Matched human perception only 55% of the time.
- TTFB: Even lower, at 53%.
- Original SpeedIndex: Only 53% accuracy.
Why did SpeedIndex fail? Because it aggregates visual progress all the way to "Visual Complete." By that time, the user has already made up their mind, and any late-loading ads or carousels create "noise" in the data that doesn't reflect the initial speed perception.
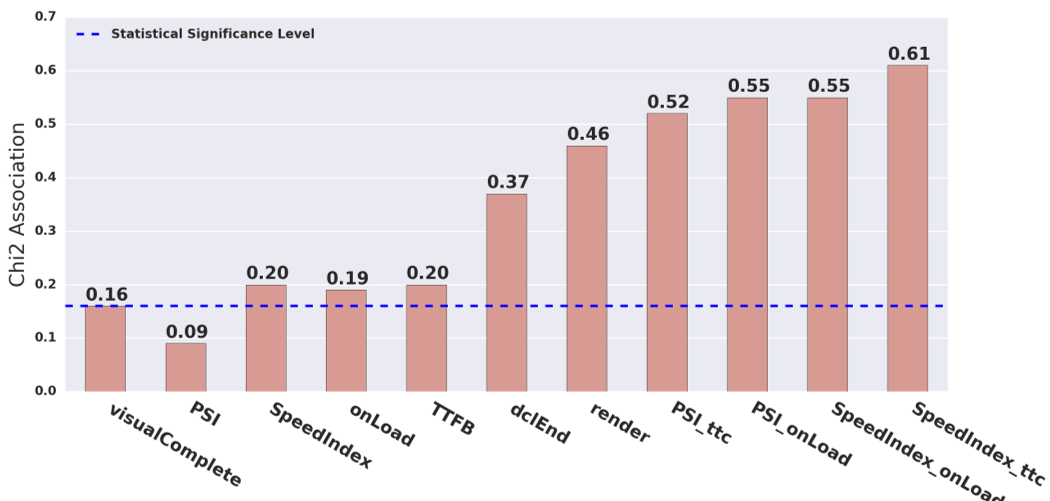 Figure 2: Rank-ordered comparison of metrics. Note how metrics integrated to TTC or onLoad significantly outperform the original SI.
The Winning Formula: A Joint ML Model
By combining SI_TTC (SpeedIndex integrated to the Time to Click), PSI_TTC, and Render Start, the authors trained a Random Forest model that hit 87 ± 2% accuracy. This suggests that
- First Paint matters significantly.
- The rate of visual progression during the early phase is the primary driver of perceived speed.
- Visual jitter post-load effectively subtracts from the QoE.
Critical Insights & Future Directions
The paper confirms that human perception is relative and early-biased. If you are a retail site owner, optimizing for the absolute "Fully Loaded" state is a waste of resources if your "Render Start" is slow or if your layout shifts violently after 2 seconds.
Limitations
The study focused on desktop retail sites. Since 2017, mobile browsing has become the dominant force, and "Core Web Vitals" (like LCP and CLS) have been introduced by Google, many of which echo the findings of this paper—specifically the impact of layout stability (closely related to the authors' PSI).
Conclusion
This work shifted the conversation from "How fast can the browser fetch data?" to "How fast does the user feel the value?" By using PSI and focusing on the early-loading window (TTC), developers can finally align their technical optimizations with real-world user satisfaction.
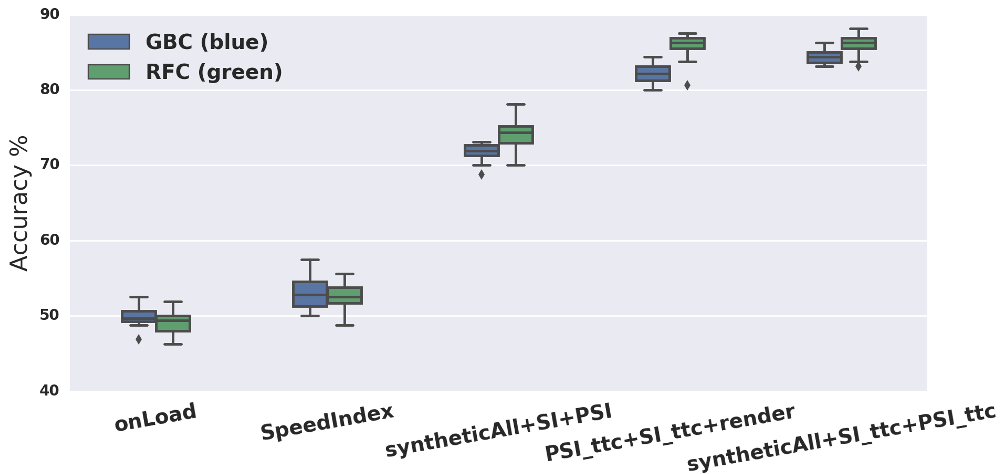 Figure 3: User feedback highlighted that "Ads," "Pop-ups," and "White Screens" were the primary detractors from a high-quality experience.