
Uncovering the Soul of the City: Mapping Urban Perception via Social Media
Uncovering the Perception of Urban Outdoor Areas Expressed in Social Media
This paper proposes a semi-automatic framework to extract and map human perceptions of urban outdoor areas (e.g., "vibrant," "scary," "touristy") by mining location-based social networks (LBSNs). The authors developed a hierarchical "UOP-dictionary" using Word2Vec and an unsupervised clustering algorithm to filter noise and identify spatially-meaningful urban sentiments in Chicago, achieving high correlation with human-validated surveys.
TL;DR
Urban planners have long relied on "sensory walks" to understand how people feel about a city, but these don't scale. This paper introduces a scalable alternative: a framework that transforms noisy Twitter data into "Perception Maps." By building a specialized dictionary and using unsupervised clustering, the researchers can now visually map whether a neighborhood feels "Vibrant," "Scary," or "Classic" with high accuracy.
The Scalability Wall in Urban Planning
Why do we love some streets and avoid others? Understanding urban perception—the subjective experience of a place—is critical for safety, tourism, and well-being. Historically, this meant hiring researchers to walk around and interview people, a process that is geographically limited and incredibly slow.
While Location-Based Social Networks (LBSNs) like Twitter offer a goldmine of real-time data, they are notoriously "trashy" for research. A tweet tagged in a park might be about a career move rather than the park itself. The challenge is: How do we filter out the noise of the digital world to capture the reality of the physical one?
Methodology: The UOP-Dictionary & Spatial Filtering
The authors tackle the noise problem through a clever two-phase methodology.
1. Learning the Language of Places
Instead of starting with Twitter, they first look at Google Places and Foursquare. These reviews are "cleaner" because people specifically go there to describe a venue.
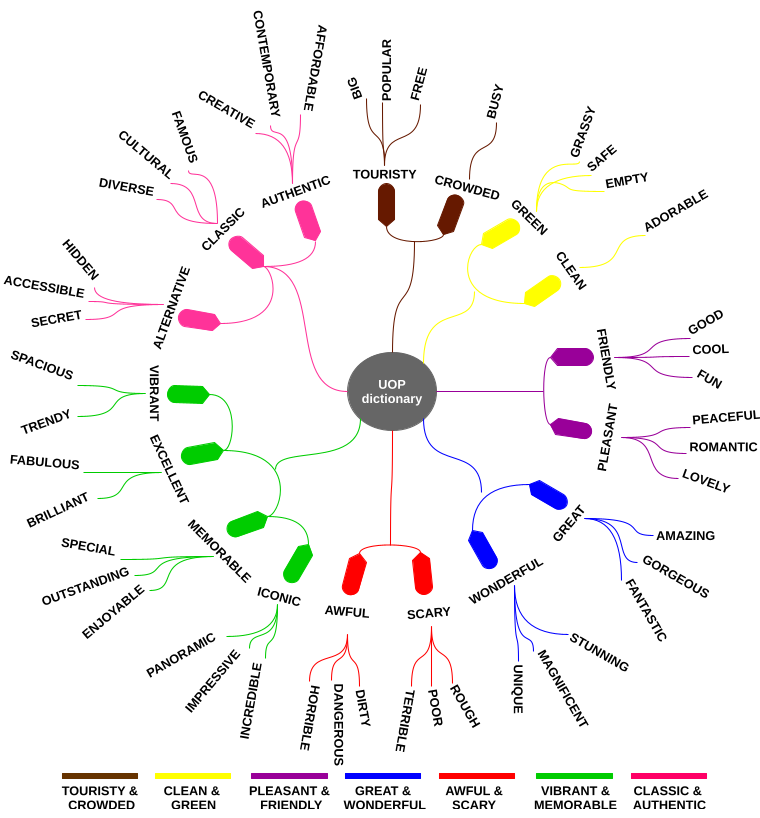
- Hierarchical Clustering: Using Word2Vec, they grouped 88 qualifier words into 7 core semantic clusters such as Clean & Green, Awful & Scary, and Pleasant & Friendly.
- The Result: A structured "UOP-dictionary" (Urban Outdoor Perception) that provides a mathematical anchor for what specific urban sentiments look like in text.
2. High-Precision Extraction
To process the chaotic Twitter stream, the authors developed Algorithm 1, which treats the city as a spatial-semantic grid:
- Spatial Debunking: It removes bot behavior (e.g., 50 tweets from the exact same GPS coordinate).
- Indoor Filtering: Using building footprints, they discard tweets sent from inside buildings to ensure the data reflects the outdoor environment.
- Semantic Scoring: Each tweet is scored against the Word2Vec model; only those with high semantic relevance to urban qualities are kept.
Experiments: Mapping Chicago
The researchers tested this on Chicago, focusing on areas like The Loop (Downtown) and Wicker Park.
By calculating a custom score——they accounted for both how many people felt a certain way (concentration) and how widespread that feeling was across the neighborhood (coverage).
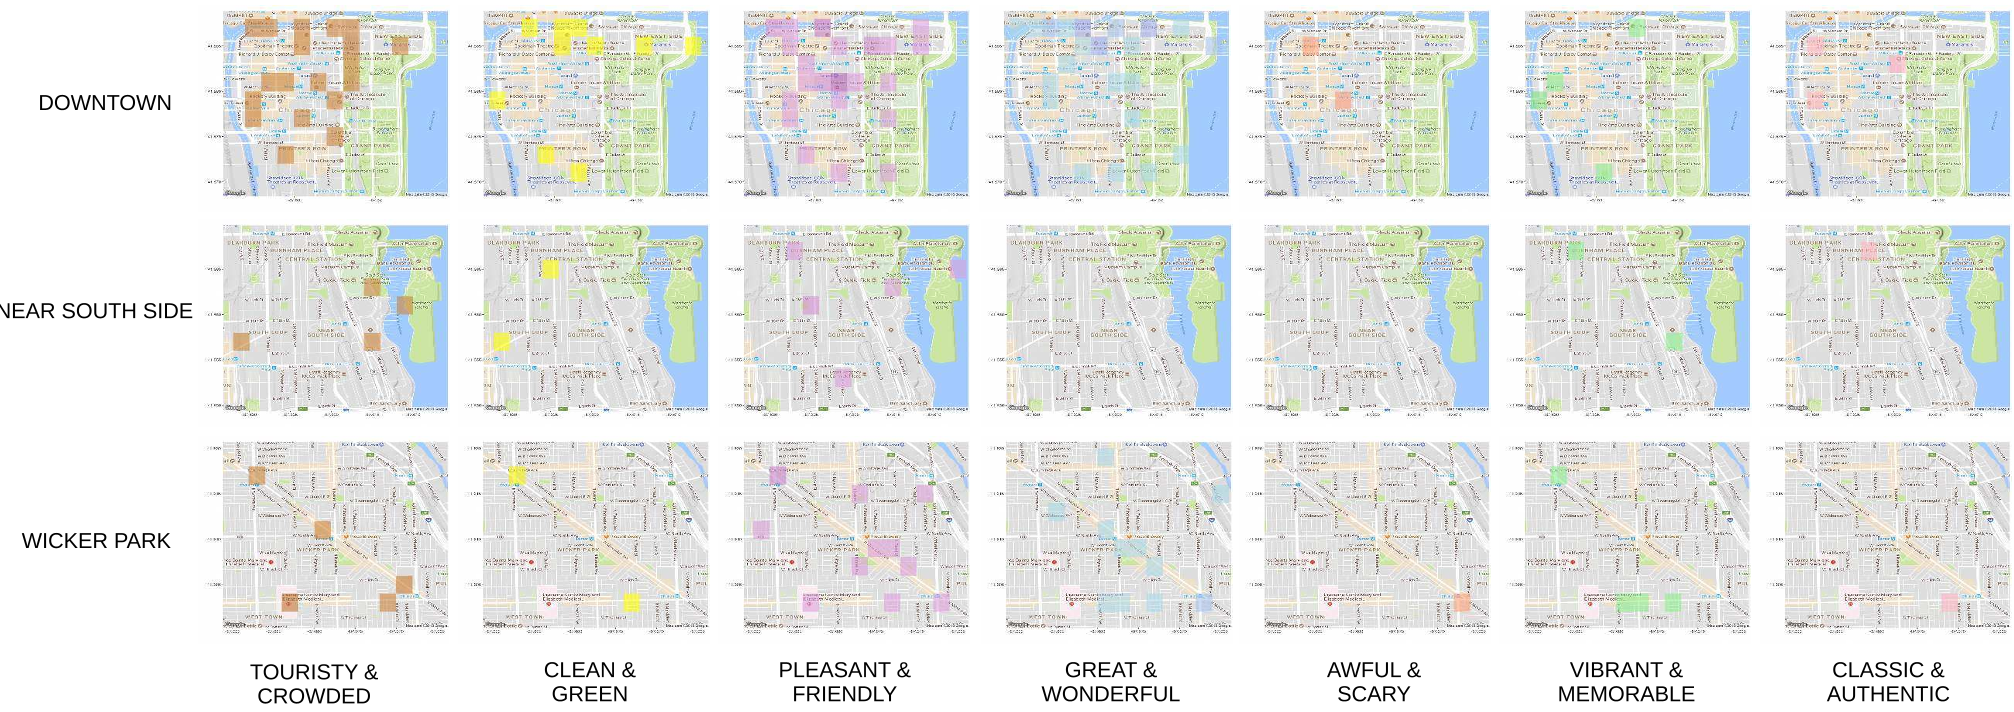
Key Finding: In Downtown Chicago, the dominant perceptions were Touristy & Crowded and Great & Wonderful. Interestingly, in Wicker Park, the algorithm correctly identified that the area was perceived as more Awful & Scary (likely due to traffic and noise) than Clean & Safe, a nuance confirmed by local residents.
Critical Analysis & Future Outlook
The "Academic SOTA" value here is the bridge between Natural Language Processing (NLP) and Geographic Information Systems (GIS). Unlike previous "Smelly Maps" or "Chatty Maps" that focus on a single sense (smell or sound), this work is a generalized framework for any thematic perception.
Limitations
- The Time Dimension: Perceptions change between 2 PM and 2 AM. The current study treats time as static.
- Contextual Sarcasm: While the algorithm filters noise, it may struggle with complex linguistic nuances where a user describes a "beautifully dangerous" area.
Conclusion
This research proves that our digital footprints are more than just social noise; they are a reflection of our physical environment. For the future of "Smart Cities," this means we could soon have GPS apps that don't just find the fastest route, but the loveliest one.
Takeaway: Urban perception is now quantifiable at scale, turning qualitative "vibes" into actionable urban data.